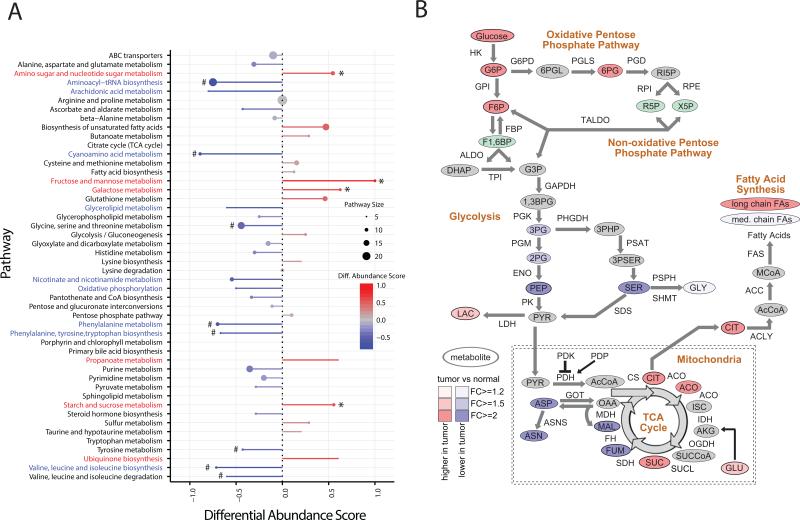
Figure 2. Pathway-based analysis of ccRCC metabolomics.
(A) A pathway-based analysis of metabolic changes upon comparing primary ccRCC to adjacent normal kidney tissues. The differential abundance score captures the average, gross changes for all metabolites in a pathway. A score of 1 indicates all measured metabolites in the pathway increase, and −1 indicates all measured metabolites in a pathway decrease. # the amino acid pathways. * glucose metabolism. (B) Metabolic changes of central carbon metabolism in ccRCC. Metabolites are labeled as color-coded ovals. Color corresponds to the log2 fold changes between tumor and normal tissues. Red, increase; Blue, decrease; Green, isomers; Gray, not measured. Enzymes for individual chemical reactions were denoted next to arrows connecting two metabolites. See also Table S3, and Figure S2.

