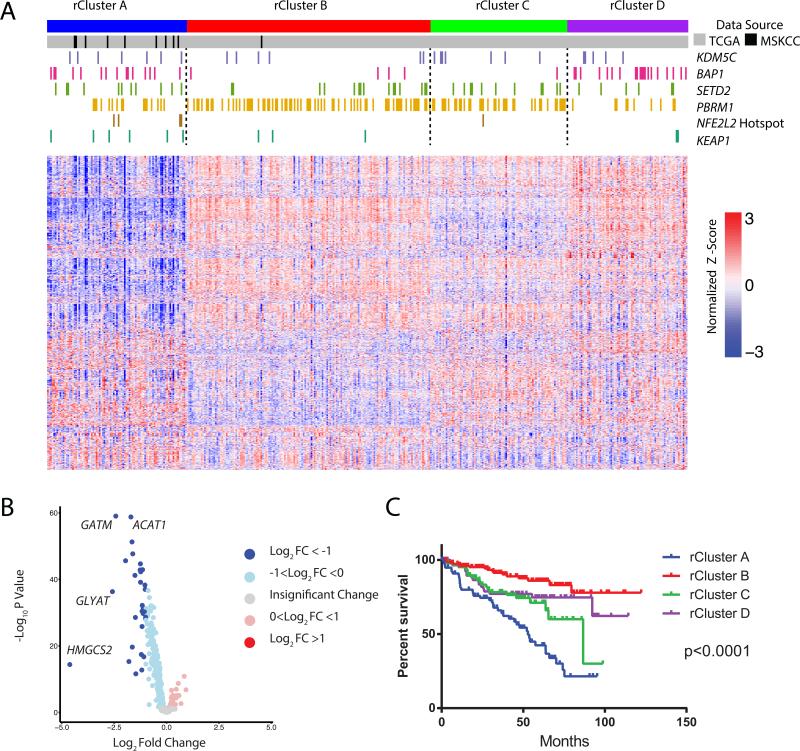
Figure 7. Mapping the MSK high glutathione ccRCC cluster with the KIRC-TCGA mutli-platform omics dataset.
(A) Consensus clustering was performed on 1,506 metabolic genes from the Recon2 human metabolic network reconstruction using RNA-Seq data from the KIRC TCGA (n = 398, gray bars), and the MSK TKCRP ccRCC Metabolomics high-glutathione tumors (n = 10, black bars). Mutations of indicated genes were marked by color bars. Depicted are the top 1000 most variable metabolic genes across the cohort, using log-normalized counts from limma voom. (B) Volcano plots of differentially expressed metabolic genes among four rClusters. HMGCS2, GLYAT, GATM, and ACAT1 are nuclear DNA-encoded mitochondrial genes. (C) Kaplan-Meier curves of cancer specific survival of individual rClusters (p value <0.0001, log-rank test). See also Table S7 and S8 and Figure S6.

