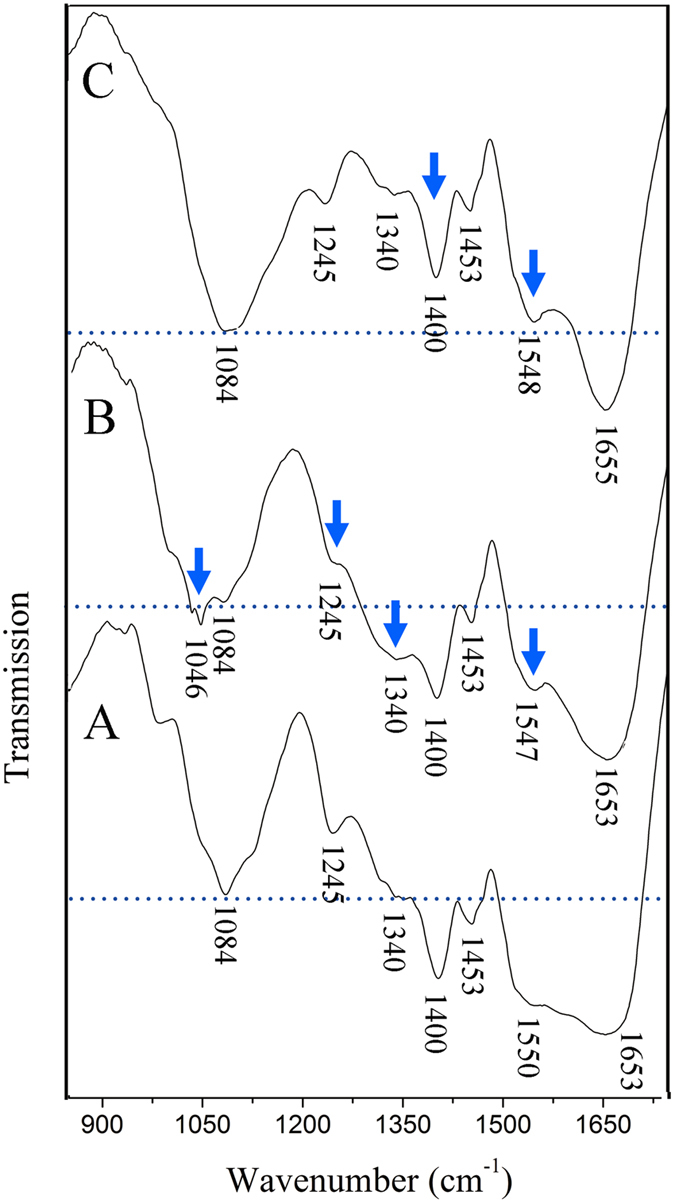
Figure 7. Comparison of FTIR spectra of EPS before and after reaction with NPs.

(A) Pristine EPS. (B) EPS reacted with ZnONPs. (C) EPS reacted with SiO2NPs. Baselines (dashed) were set according to the stretching band of the stable polysaccharide hydroxyl to compare the changes of other groups.
