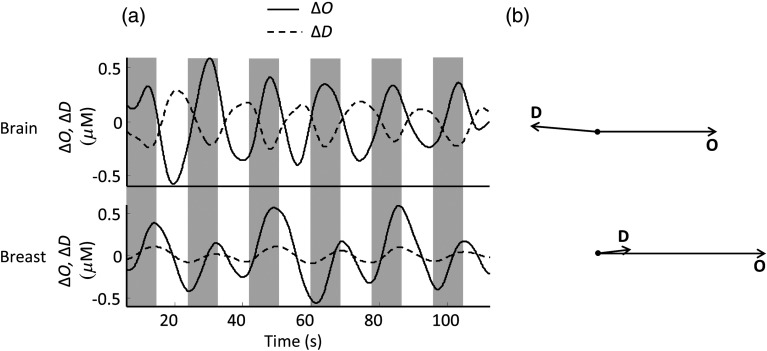
Fig. 4.
(a) Time traces of changes in oxy- and deoxyhemoglobin concentrations ( and , respectively) measured during the cyclic cuff occlusion protocol at 0.056 Hz for subject no. 1. The periods of time when the thigh cuffs were inflated are shaded. The top panel shows the out-of-phase behavior of and oscillations in the healthy brain. The bottom panel reports the breast data and shows the in-phase behavior of and oscillations in the healthy breast. (b) Phasor diagrams corresponding to the oscillations reported in (a). The phasor diagram in the top panel shows the out-of-phase and phasors in the healthy brain, whereas the one in the bottom panel shows the approximately in-phase and phasors in the healthy breast.

