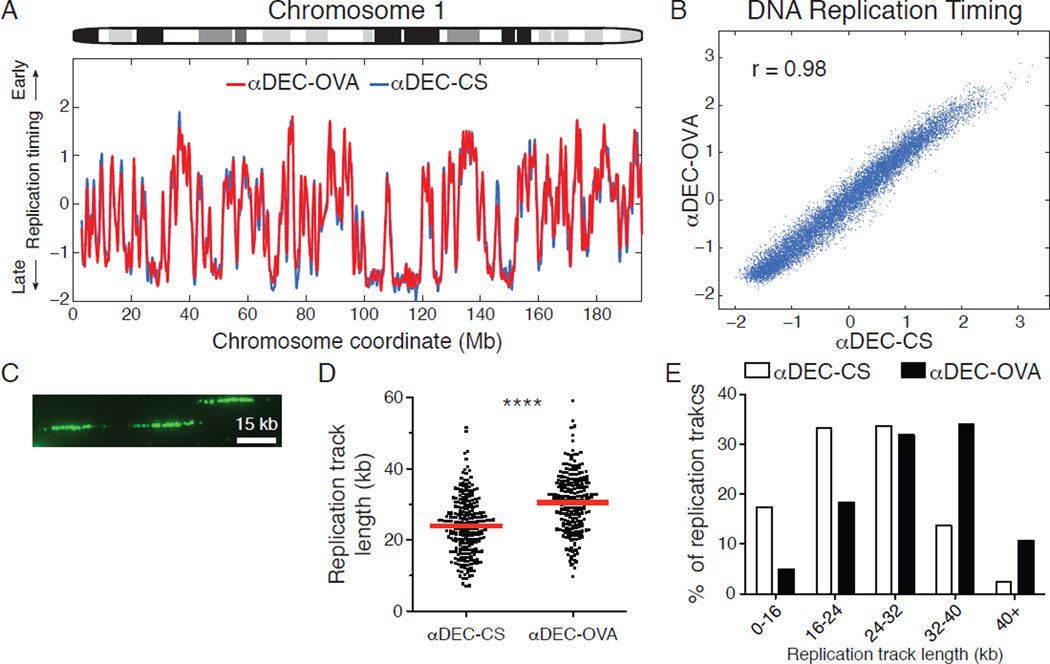
Figure 4. T cell help accelerates S phase by regulating the speed of DNA replication elongation.
(A) Replication timing profile of chromosome 1 was determined by analyzing the ratio of DNA copy number between sorted S and G1 phase B1–8hi DEC205+/+ GC B cells treated with αDEC-CS or αDEC-OVA 2 days earlier. (B) Genome-wide correlation between replication timing in the two conditions. (C) Representative IdU-labeled DNA fibers are shown. (D) Replication track lengths from αDEC-CS or αDEC-OVA treated B1–8hi DEC205+/+ GC B cells. Each data point represents an IdU-labeled track, and red lines represent mean values. Results are pooled from 2 independent experiments and involve over 220 measured fibers in total for each condition. (E) Distribution of replication track lengths. **** p < 0.0001, Two-tailed Mann-Whitney test.

