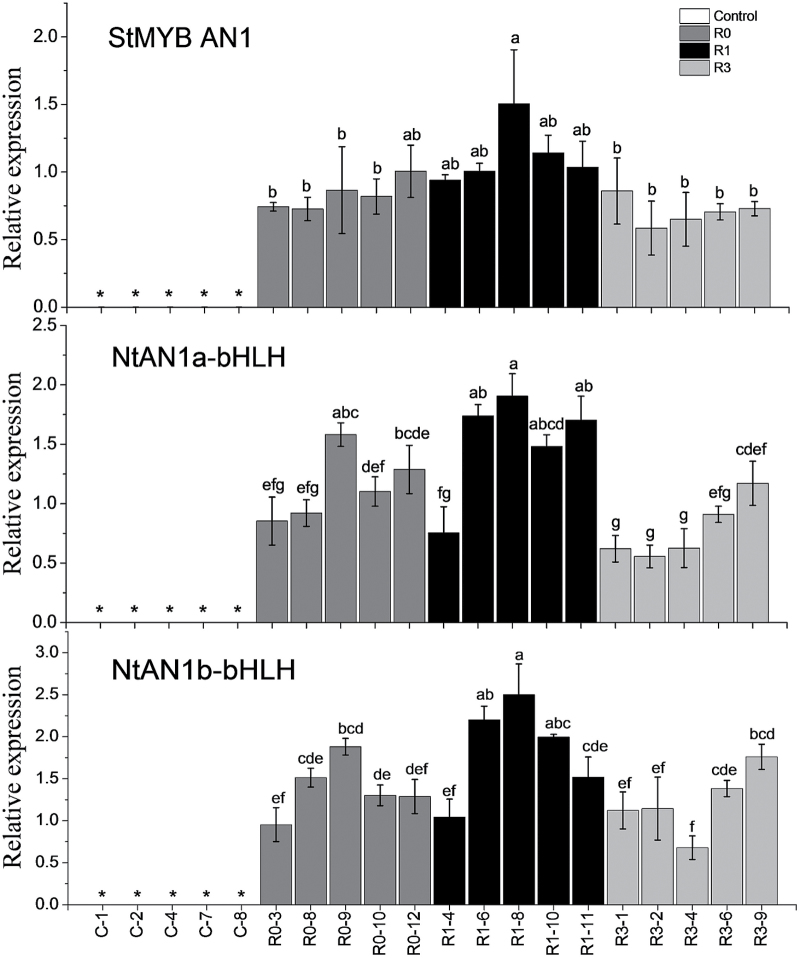
Fig. 8.
Quantitative analysis of transcript levels of StMYB AN1, NtAN1a-bHLH, and NtAN1b-bHLH in tobacco transgenic lines. The data represent the means±SE of three biological replicates. Statistical significance was determined by one-way ANOVA; significant differences between means (LSD, P<0.05) are indicated where letters above the bars differ. Genotypes denoted by * showed no detectable levels of expression.

