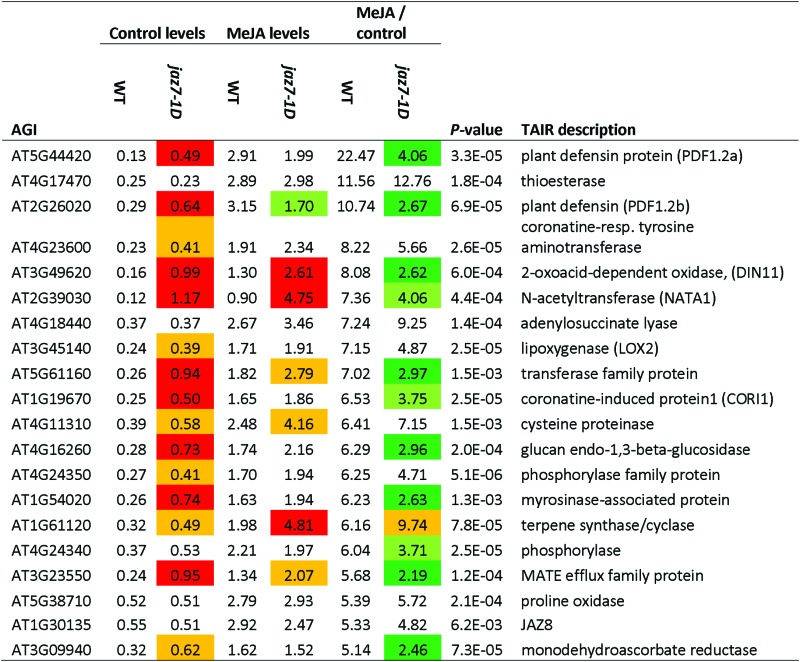
Table 1.
Subset of genes differentially regulated by MeJA treatment from the microarray
Shown are the top 20 wild-type MeJA/control-induced genes (data obtained from Supplementary Table S10). Colour coding: change in jaz7-1D over wild-type (WT) under each analysis; >2-fold, red; >1.5-fold, orange; <2-fold, green; <1.5-fold, lime.

|
