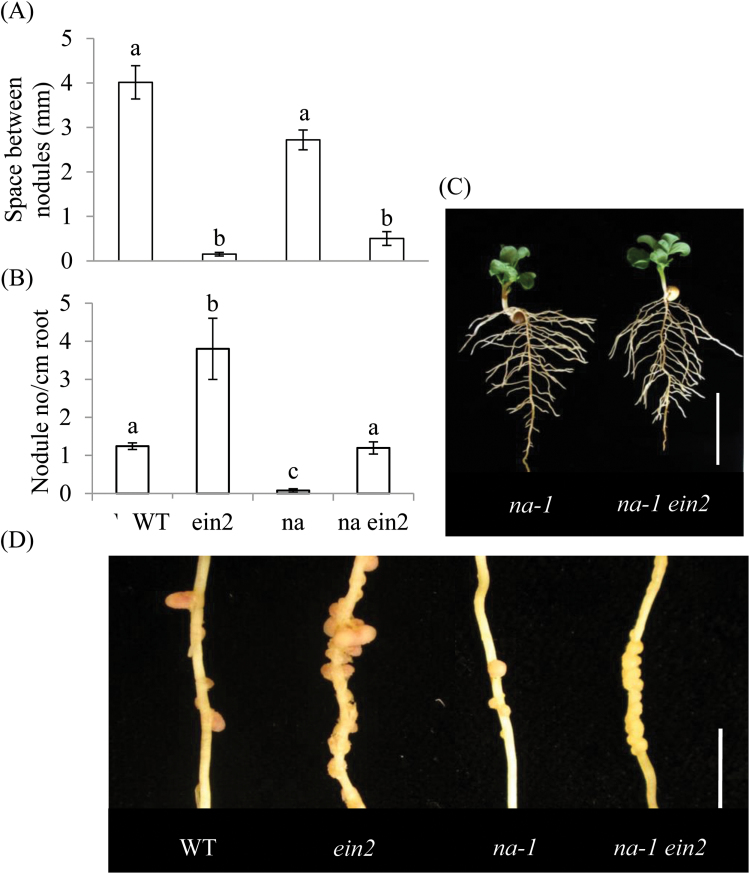
Fig. 6.
Nodulation in wild-type, ein2, na, and na ein2 double-mutant plants. Plants were grown under nitrate-free conditions for 32 days. (A) Average space between nodules. (B) Number of nodules per cm of root. (C) Photograph of whole plants of na and na ein2 (scale bar=5cm). (D) Photograph of nodules on a secondary root (tertiary roots have been removed; scale bar=1cm). Values with different letters above the bars indicate differences at P<0.05. Values are mean±SE (n=6). (This figure is available in colour at JXB online.)

