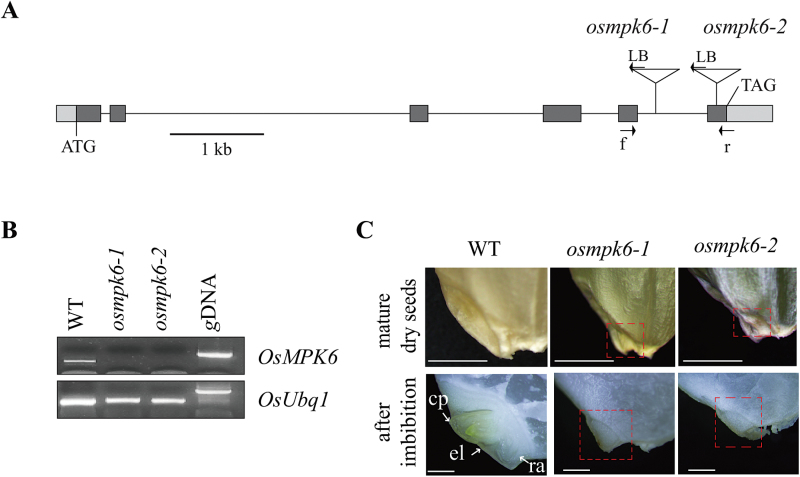
Fig. 1.
Characterization of T-DNA insertion mutants in OsMPK6.
(A) Gene structure of OsMPK6. Dark-grey boxes indicate exons; light-grey boxes, UTRs; lines connecting boxes, introns. Triangles are T-DNA insertions of osmpk6-1 (line 3A-60391) and osmpk6-2 (line 2A-10337). Arrows f (forward), r (reverse), and LB (left border) are primers used for genotyping and RT-PCR analyses of OsMPK6 transcript levels. Scale bar = 1kb. (B) Measurement of MPK6 transcript levels by RT-PCR. Rice Ubiquitin 1 (OsUbi1, Os03g0234200) served as control. (C) Embryo phenotypes of WT, osmpk6-1, and osmpk6-2. Upper panel presents mature embryos from dry seeds; lower panel, embryos after imbibition. Red dotted boxes show the mutant embryo regions. cp, coleoptile; el, embryonic leaves; ra, radicle. Bars = 1mm. (This figure is available in colour at JXB online.)

