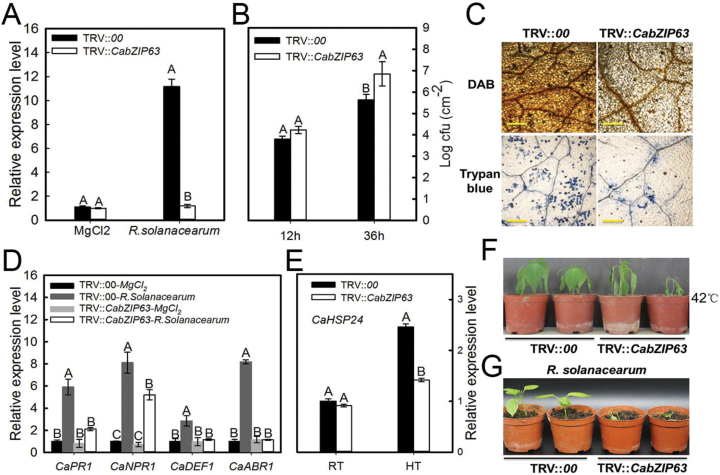
Fig. 2.
Distinct responses of CabZIP63-silenced pepper plants to RSI and HTHH. (A) Real-time RT–PCR analysis of CabZIP63 expression in R. solanacearum-inoculated or mock-treated (inoculated with solution of MgCl2) CabZIP63-silenced pepper (TRV::CabZIP63) and control (TRV::00). (B) Detection of growth of R. solanacearum in CabZIP63-silenced or control pepper plants inoculated with R. solanacearum at 12h and 36h. (C) Trypan blue staining and DAB staining in R. solanacearum-inoculated CabZIP63-silenced (TRV::CabZIP63) and empty vector (TRV::00) pepper leaves at 2 days post-inoculation (dpi). Scale bars=50 μm. (D) Real-time RT–PCR analyses of transcription levels of the tested defense-related genes in CabZIP63-silenced pepper (TRV::CabZIP63) and control (TRV::00) after inoculation with or without R. solanacearum. (E) Real-time RT–PCR analyses of transcription levels of the thermotolerance-related CaHSP24 in CabZIP63-silenced pepper (TRV::CabZIP63) and control (TRV::00) with or without high temperature (HT) treatment. (F) The pepper plants were treated at 42 °C for 24h, and then kept under normal temperature conditions (25 °C) for 24h before checking the phenotype. (G) Phenotypic effect of R. solanacearum attack on CabZIP63-silenced (TRV::CabZIP63) and control (TRV::00) plants at 14 dpi. Data represent the means ±SD from four independent experiments. Different letters indicate significant differences, as determined by Fisher’s protected LSD test (P<0.01). (This figure is available in colour at JXB online.)

