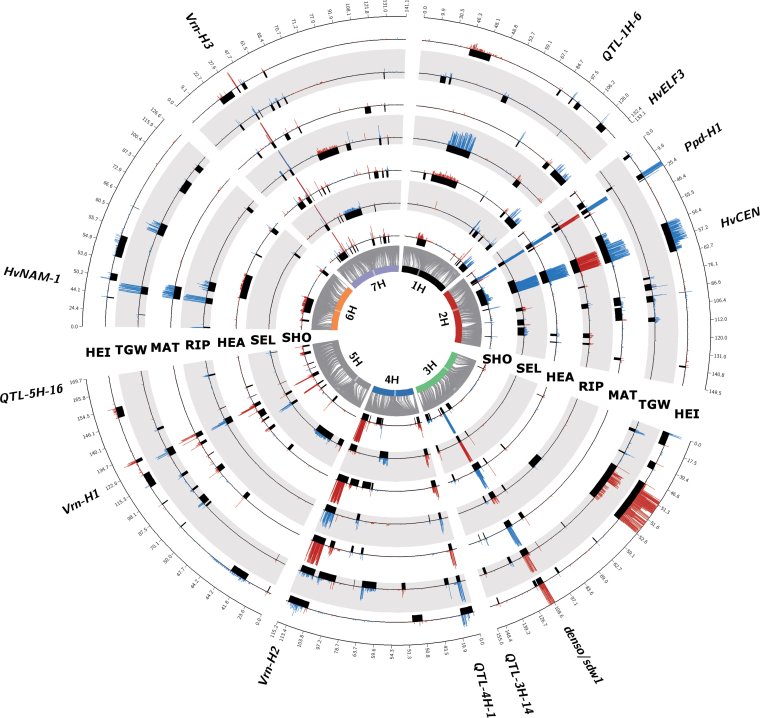
Fig. 1.
Comparison of GWAS results across developmental traits, thousand grain weight and plant height. Barley chromosomes are indicated as coloured bars on the inner circle, and centromeres are highlighted as transparent boxes. Grey connector lines represent the genetic position of SNPs on the chromosomes, which is given in centimorgans on the outer circle. Each track represents one trait, and these are (from inside to outside) SHO, SEL, HEA, RIP, MAT, TGW and HEI. Trait abbreviations are given in Table 1. Black boxes indicate the QTL positions. The height of histogram bars above represent the detection rate across 200 repeated random subsamples. The blue and red colours of the bars indicate trait-reducing and trait-increasing effects, respectively, exerted by exotic QTL alleles. Candidate genes of major QTLs are indicated outside the circle.

