Fig. 5.
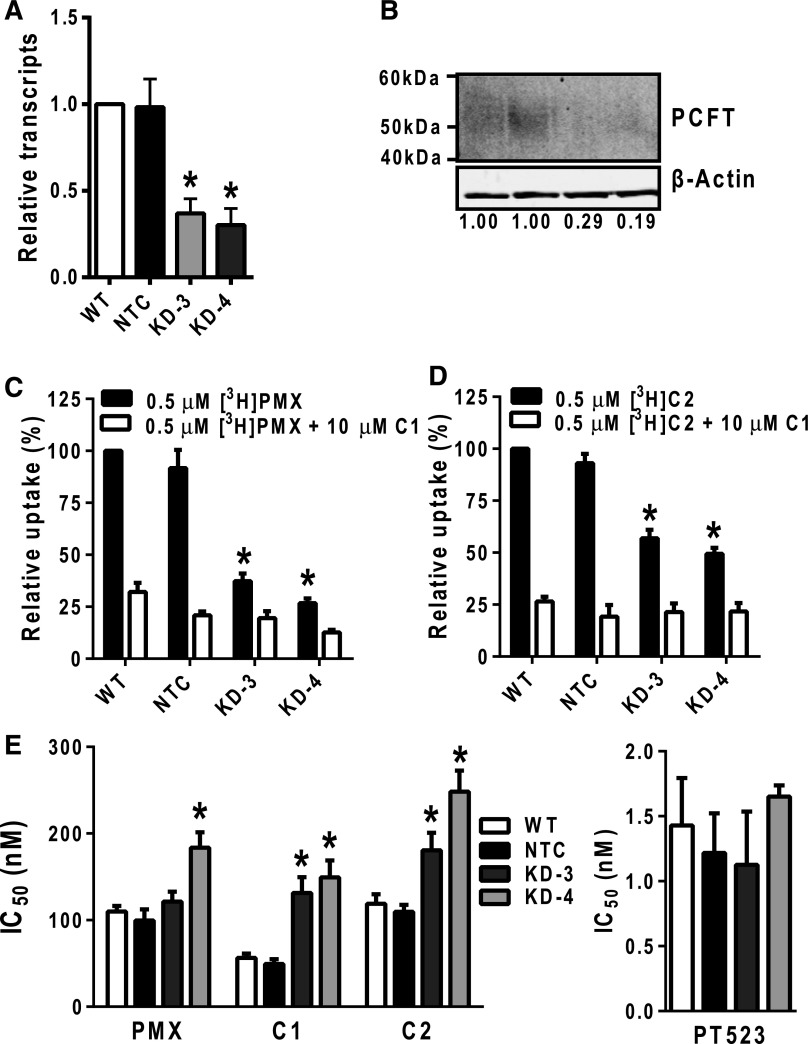
Characterization of H460 PCFT KD cells. (A) Real-time RT-PCR was used to measure transcript levels for PCFT in H460 wild-type (WT), NTC, KD-3, and KD4 cells. Transcript levels were normalized to β-actin and results are presented relative to those for WT H460 cells (assigned a value of 1). Results are expressed as mean ± S.E. values and represent triplicate experiments. The asterisks indicate a statistically significant difference between the PCFT KD gene expression and that for the NTC cells (P < 0.05). (B) H460 particulate membrane fractions were isolated as described in Materials and Methods. Membrane proteins (30 μg) from WT, NTC, KD-3, and KD4 H460 cell lines were electrophoresed on a 7.5% polyacrylamide gel and immunoblotted with PCFT antibody. β-Actin protein levels were used as loading controls. Densitometry was measured using Odyssey software, and PCFT protein expression was normalized to β-actin. Normalized densitometry results (average from four experiments) are noted below each lane. (C and D) WT, NTC, KD-3, and KD-4 H460 cells (in 60-mm dishes) were incubated with 0.5 μM [3H]PMX and [3H]C2 at pH 5.5 and 37°C, with or without 10 μM nonradioactive C1 for 2 minutes. Internalized [3H]PMX or [3H]C2 was normalized to total cell protein and results calculated as pmol/mg. Uptake results are presented as relative uptake with WT H460 cells assigned a value of 100%. Results are expressed as mean ± S.E. values, representative of triplicate experiments. The asterisks indicate a statistically significant difference between the PCFT transport activity in the KD (KD-3 and KD-4) cells and that of the NTC cells (P < 0.05). (E) The H460 sublines including WT, NTC, KD-3, and KD-4 H460 cells were cultured in complete folate-free RPMI 1640 with 25 nM leucovorin in 96-well plates at 1500 cells/well with varying concentrations of PMX, C1, C2 (left panel), or PT523 (right panel) for 4 days. Viable cells were measured by a fluorescence-based assay (Cell Titer Blue) and IC50 values were determined graphically. Results are expressed as mean IC50 ± S.E. values from triplicate experiments (the asterisk indicates where IC50 values for PCFT KD cells are significantly greater than for NTC; P < 0.05).

