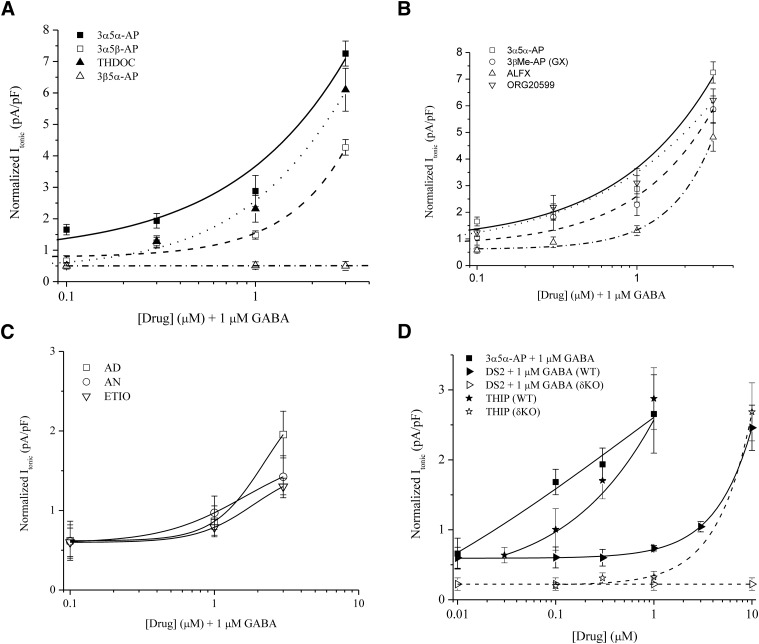
Fig. 6.
Neurosteroid SARs on extrasynaptic δGABAA receptor–mediated tonic inhibition. Concentration-response curves of neurosteroids as measured by tonic current from DGGCs (pA/pF) from patch-clamp recordings. (A) Endogenous pregnane neurosteroid responses. Lines represent nonlinear curve fit by the neurosteroids 3α5α-AP (solid), 3α5β-AP (dash), THDOC (dot), and 3β5α-AP (dash-dot). (B) Synthetic neurosteroid response curves in comparison between 3α5α-AP (solid), GX (dash), ALFX (dash-dot), and ORG-20599 (dot). (C) Androstane neurosteroid responses to AD (squares), AN (circles), and ETIO (triangles) exhibited relative decrease to potency and efficacy for extrasynaptic receptors. (D) Tonic current responses for the δ-selective compounds THIP (stars) via direct activation and DS2 (triangles) allosteric modulation compared with AP (squares). Both WT (closed symbols) and δKO (open symbols) DGGC responses are depicted. The AP concentration response is from WT DGGCs. To note, + 1 μM GABA denotes allosteric modulation by coapplication of the drug compound with GABA in the bath perfusion, whereas THIP was applied alone in bath solution. (A–C) On the x-axis, + 1 μM GABA denotes allosteric modulation by coapplication of the drug compound with GABA in the bath perfusion. All data were derived from female (diestrus I) WT DGGCs. All cells were voltage clamped in whole-cell mode at −65 mV. n = 4–10 cells per concentration and drug.

