Fig. 4.
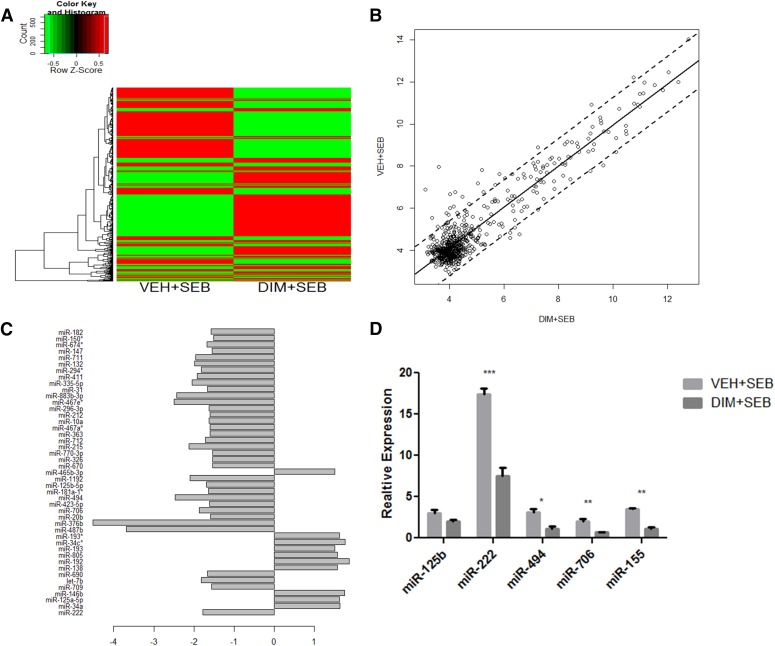
miRNA expression profiling. miRNA was isolated from lung mononuclear cells from mice exposed to SEB or SEB and DIM as described in Fig 1. (A) Differential expression heat map of 609 miRNAs between VEH + SEB and DIM + SEB groups. (B) Pearson correlation scatter plot of mi99RNA log2 expression values for VEH + SEB and DIM + SEB groups. (C) Bar plot of fold changes of differentially expressed miRNA in DIM + SEB showing >1.5-fold difference in expression compared with VEH + SEB. (D) Quantitative real-time PCR validation of select dysregulated miRNA. RNU1a and Snord96a were used as endogenous control, and expression level was normalized to vehicle. Vertical bars in (D) represent mean ± S.E.M. from groups of four or five mice. **P < 0.01; *P < 0.05 compared with vehicle.

