
Figure 2. Heat map of pathways enriched in gastric cancer by GSEA analysis.
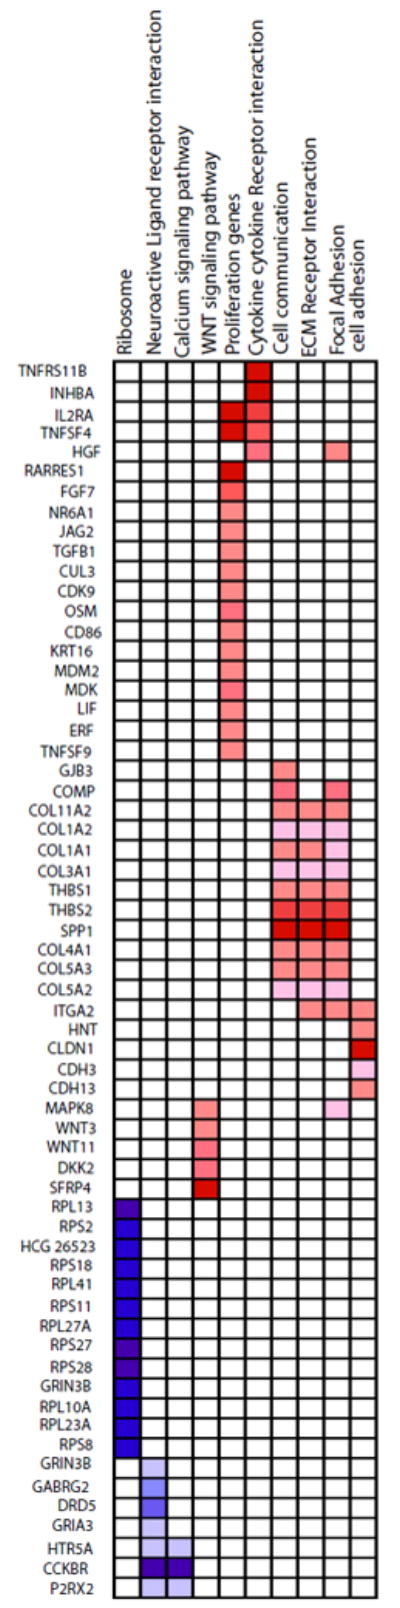
Pathways that were enriched by GSEA and the genes that led to their enrichment are shown. Downregulated genes are represented in shades of blue while upregulated genes are represented in shades of red.