
Figure 3. Biological network analysis of differentially expressed genes in gastric adenocarcinoma.
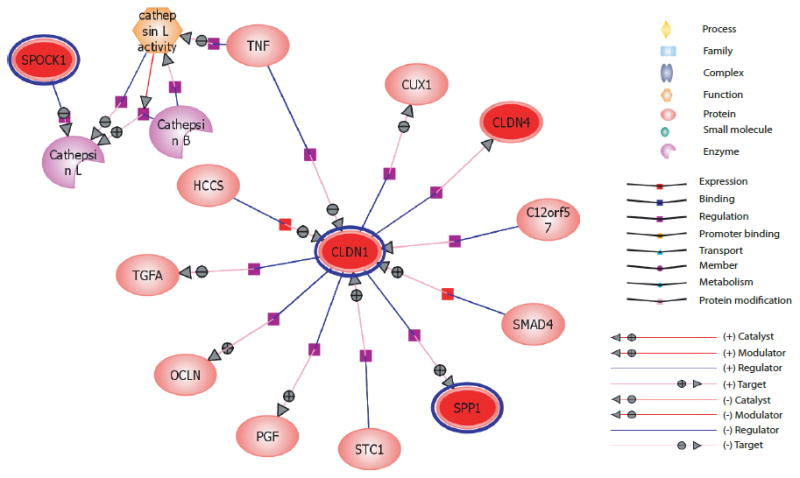
Illustration of sub-networks identified by network analysis. SPP1, SPOCK1, CLDN1 and CLDN4 overexpressed in gastric adenocarcinoma form a closely interconnected network through CLDN1. The key to the various processes/relationships are provided in the figure.