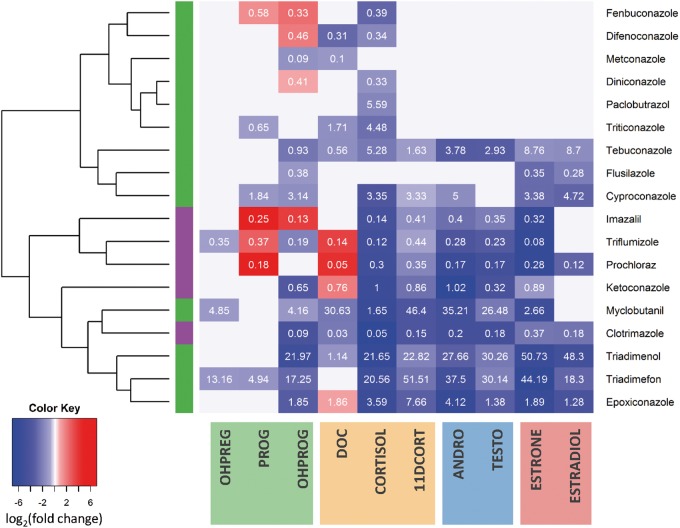
FIG. 3.
Profiling conazole fungicides effects on steroidogenesis. Heatmap visualizing the effect of 18 conazoles across the 10 hormones. The heatmap was generated to visualize the maximum fold change (in log2) achieved from concentration-dependent increase (red) or decrease (blue) in hormone levels with hierarchical clustering conducted using Euclidean distance metric to sort the conazoles. The AC50 concentration (µM) for the effect is overlaid in white print. A bar on the left identifies imidazole (purple) versus triazole (green) conazoles. Hormones are grouped and highlighted based by progestagen (green), glucocorticoid (yellow), androgen (blue), and estrogen (red) across the bottom. In total, 20 conazoles were evaluated in CR, with the 18 depicted conazoles having concentration-dependent effects on at least one hormone.

