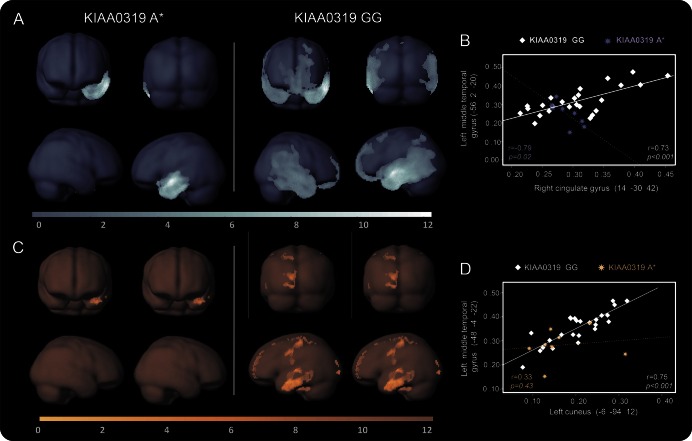
Figure 4. Gray and white matter structural connectivity analyses in patients with PPA according to KIAA0319 genotype.
Pattern of gray matter (A) and white matter (C) structural correlation of the middle temporal gyrus with other regions of the brain in primary progressive aphasia (PPA) KIAA0319 A* vs PPA KIAA0319 GG. Linear correlation of decreased gray matter (B) and white matter (D) structural association between brain regions in PPA KIAA0319 A* (dashed lines) vs PPA KIAA0319 GG (continuous lines). The results are superimposed on a 3D-standardized T1 brain template. p < 0.001 uncorrected, voxel threshold = 100. Color bar: T values.

