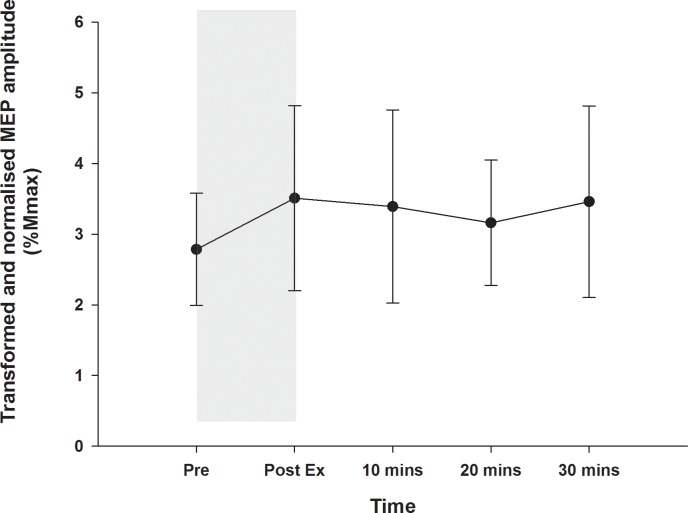
Fig 4. Corticomotoneuronal excitability following exercise.
The MEP amplitudes, normalised to Mmax for each individual and square root transformed, are shown for the exercise only condition, with the shaded area indicating the period when 30 mins of low intensity cycling was performed. There was no change in excitability over time (P = 0.661).

