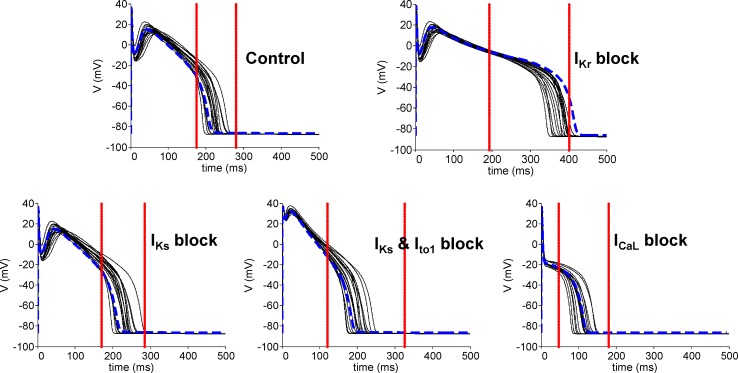
Fig 2. Deterministic model single AP traces.
Single AP traces obtained using the seventeen deterministic models, simulated with a BCL of 1000 ms under: control conditions (top left), complete IKr inhibition (top right), complete IKs inhibition (bottom left), complete IKs and 90% Ito1 inhibition (bottom middle) and 95% ICaL inhibition (bottom right). Red vertical lines represent the maximum and minimum APD values derived from experimental data for the same simulation protocol. The blue dotted AP trace represents the Decker model without any rescaling of the ionic currents.

