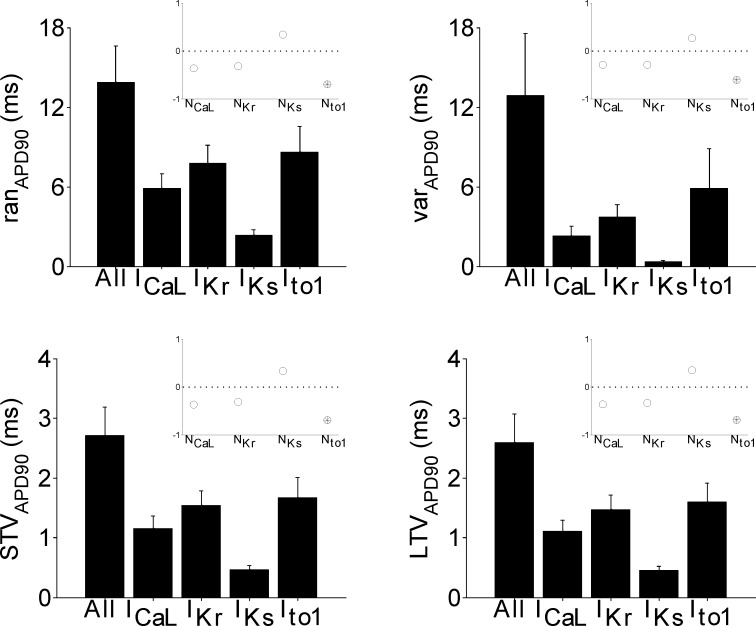
Fig 6. Variability in APD across the population of models under control conditions.
Bar graphs showing the mean and standard deviation of APD variability measurements across the seventeen models from simulations where all currents are stochastic and also when stochasticity is incorporated into each individual current, under control conditions. The measures of variability are ranAPD (top left), varAPD (top right), STVAPD (bottom left) and LTVAPD (bottom right). Insets: Partial correlation coefficients between variability measures and ion channel numbers, with black dots and open circles indicating significant and not significant correlation, respectively.

