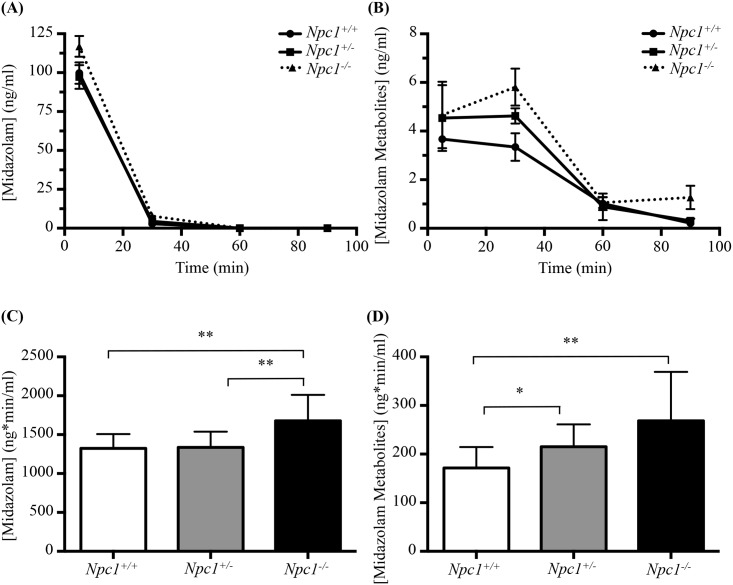
Fig 3. In vivo assay of Midazolam metabolism Npc1+/+, Npc1+/-, and Npc1-/- mice.
(A) Midazolam plasma concentration (in ng/ml) as a function of time. (B) Midazolam metabolites plasma concentration (in ng/ml) as a function of time. (C) and (D) Differences in exposure between genotypes. Data are presented as mean ± SD for each genotype, n = 3. * p—value <0.05, ** p—value < 0.01, calculated using two-tailed, unpaired t test with Welch’s correction as necessary and one-way ANOVA.

