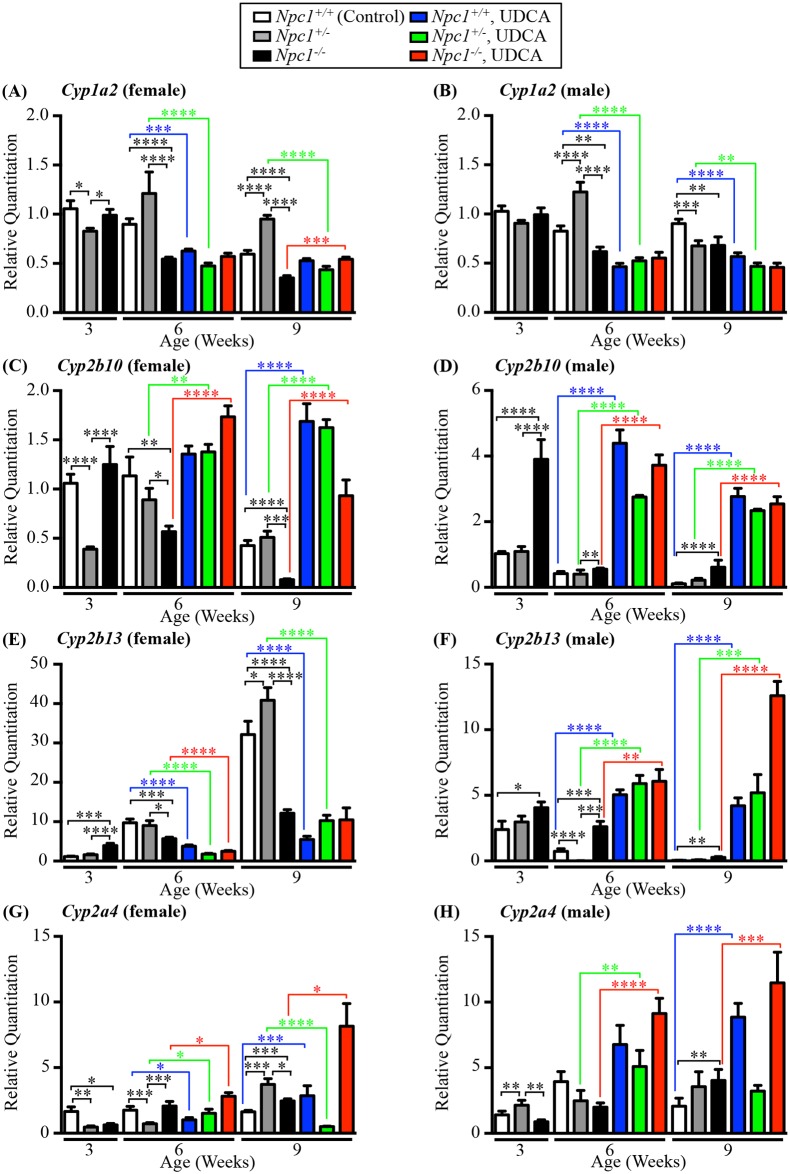
Fig 6. Gene expression analysis pre and post UDCA therapy.
Gene expression analysis of 4 CYP genes expression by qPCR in Npc1+/+, Npc1+/- and Npc-/- mice (untreated and treated with UDCA) at 3, 6 and 9 weeks old in females and males. White columns indicate Npc1+/+ samples, grey columns indicate Npc1+/-, black columns indicate Npc1-/-, blue columns indicate Npc1+/+ treated with UDCA, green columns indicate Npc1+/- treated with UDCA and red columns indicate Npc1-/- mice treated with UDCA. (A-B) Cyp1a2 gene expression. (C-D) Cyp2b10 gene expression. (E-F) Cyp2b13 gene expression. (G-H) Cyp2a4 gene expression. Data are presented as mean ± SEM, n = 3–6. * p—value < 0.05, ** p—value < 0.01, *** p—value < 0.001, **** p—value < 0.0001, calculated using an unpaired nonparametric Mann-Whitney test.

