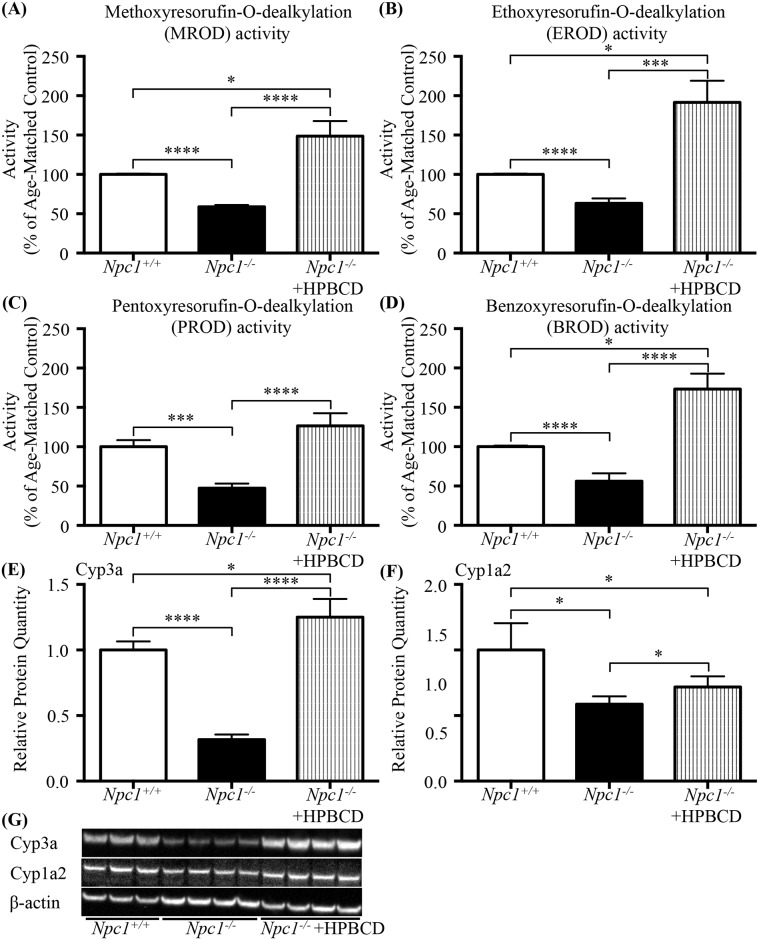
Fig 7. Effect of HPBCD treatment in 7-week old male Npc1-/- mice.
(A-D) Effects of HPBCD treatment on the activity of CYP450 catalysed reactions in the Npc1 mouse presented as a function of percent of age-matched control littermates. (A) Methoxyresorufin-O-dealkylation (MROD); (B) ethoxyresorufin-O-dealkylation (EROD); (C) pentoxyresorufin-O-dealkylation (PROD); (D) benzoxyresorufin-O-dealkylation (BROD). Data are presented as mean ± SEM, n = 4 (males), * p—value < 0.05, *** p—value < 0.001, **** p—value < 0.0001 calculated using an unpaired nonparametric test Mann-Whitney test. (E) Relative protein quantitation of Cyp3a found a significant decrease in Npc1-/- untreated mice compared Npc1+/+ untreated mice similar to what was seen in Fig 4C. HPBCD treatment increased Cyp3a protein levels in Npc1-/- mice, both in comparison to the untreated Npc1+/+ or Npc1-/- mice. (F) Relative protein quantitation of Cyp1a2 revealed a significant decrease in Npc1-/- untreated mice compared Npc1+/+ untreated mice. HPBCD treatment increased Npc1-/- mice Cyp1a2 protein levels in comparison to untreated Npc1-/- mice, but did not restore to Npc1+/+ levels. Data are presented as mean ± SD, n = 4. * p—value < 0.05, **** p—value < 0.0001 calculated using two-tailed, unpaired t test. (G) Representative western blot analysis of Cyp3a and Cyp1a2 isolated from 7 week old male Npc1+/+ or Npc1-/- mouse livers plus or minus HPBCD treatment.

