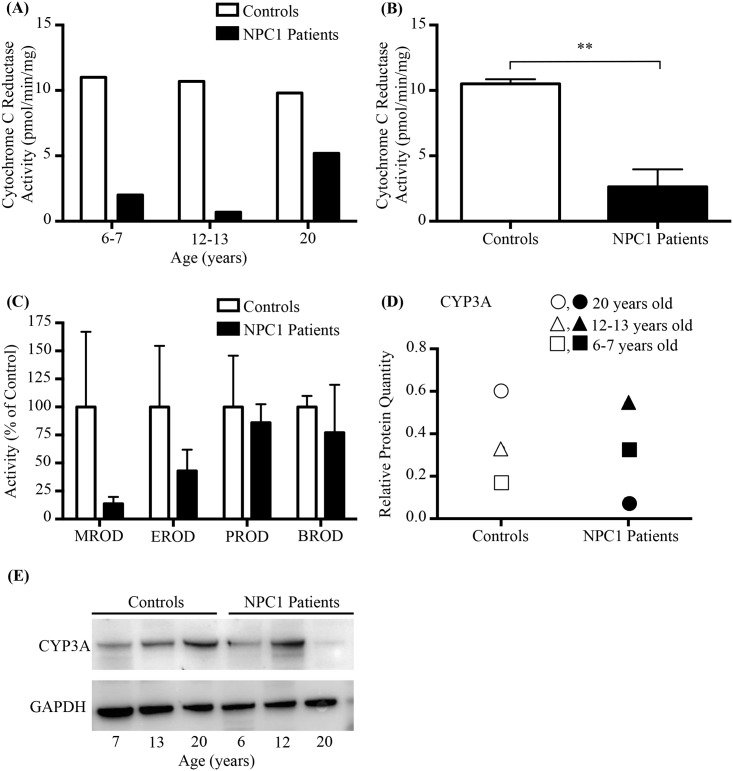
Fig 9. NPC1 patient P450 Analysis.
(A) Activity of cytochrome C reductase in individual NPC1 patients at various disease stages and age- and gender-matched controls. Data are expressed as pmoles cytochrome C reduced per minute, normalised for microsomal protein content (mg). (B) Combined patient samples from panel A, Activity of cytochrome C reductase in liver microsomes from NPC1 patients and age-and gender-matched controls. (C) Activity of CYP450 catalysed reactions in NPC1 patients and age-and gender-matched controls. Data are expressed as percentage of age-matched controls. Each individual sample was run in triplicate. (D) Relative CYP3A protein quantification from Western Blot analysis in livers from NPC1 patients and controls. The circles indicate the 20 year old NPC1 and control individuals, the triangles the 12–13 year old NPC1 and control individuals, and the squares represent the data from the 6 to 7 year old NPC1 and control individuals. (E) Representative western blot analysis of CYP3A in livers of NPC1 patients and their age- and gender-matched controls. Data are presented as mean ± SEM, n = 3. ** p—value < 0.01, calculated using two-tailed, unpaired t test.

