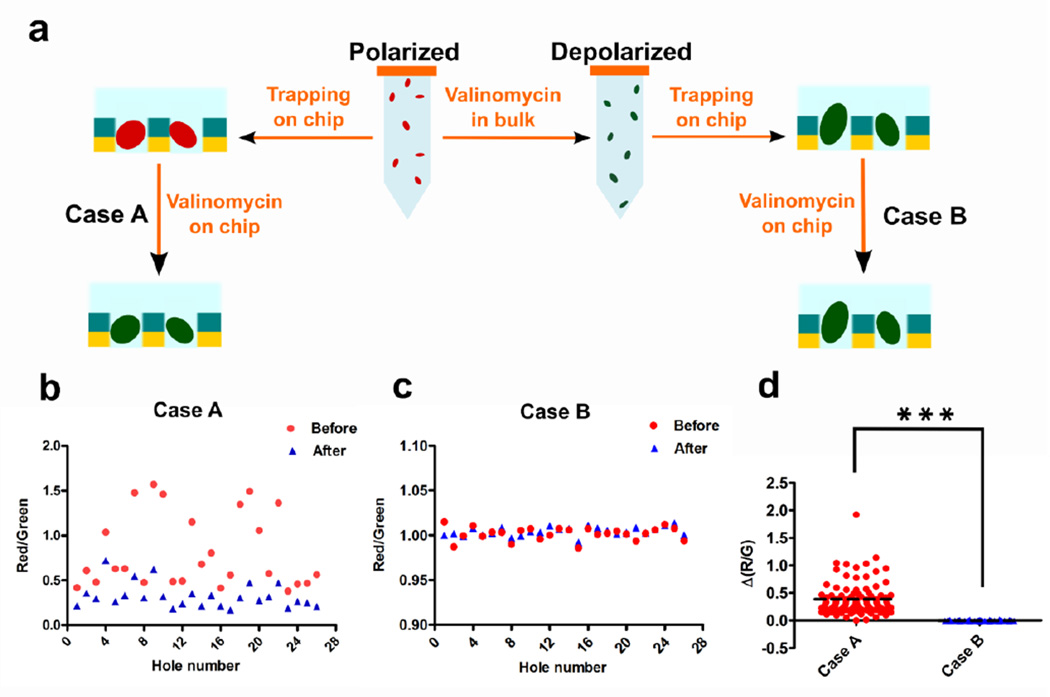
Figure 3.
Mitochondria tagged with JC-1 dye were treated with valinomycin and the change in the ratio of red-to-green fluorescence was monitored for each nanohole. (a) Depiction of the experimental scheme using two samples of mitochondria. On-chip valinomycin addition to polarized mitochondria has been termed as Case A whereas addition of valinomycin to already depolarized mitochondria has been termed as Case B. (b) 25 holes on an array containing polarized mitochondria i.e. case A. Vertically aligned data points were obtained from the same hole before and after on-chip valinomycin addition. (c) 25 holes on an array containing bulk-depolarized mitochondria i.e. case B. Vertically aligned data points were obtained from the same hole before and after on-chip valinomycin addition. (d) The difference in the red-to-green fluorescence ratio (i.e. Δ(R/G) = R/G before − R/G after) shown for an array with polarized mitochondria (case A) and pre-depolarized mitochondria (case B). T-test indicates significant difference in the change observed for the two cases, ***p < 0.0001. Dashed line indicates the mean value for all the plots.

