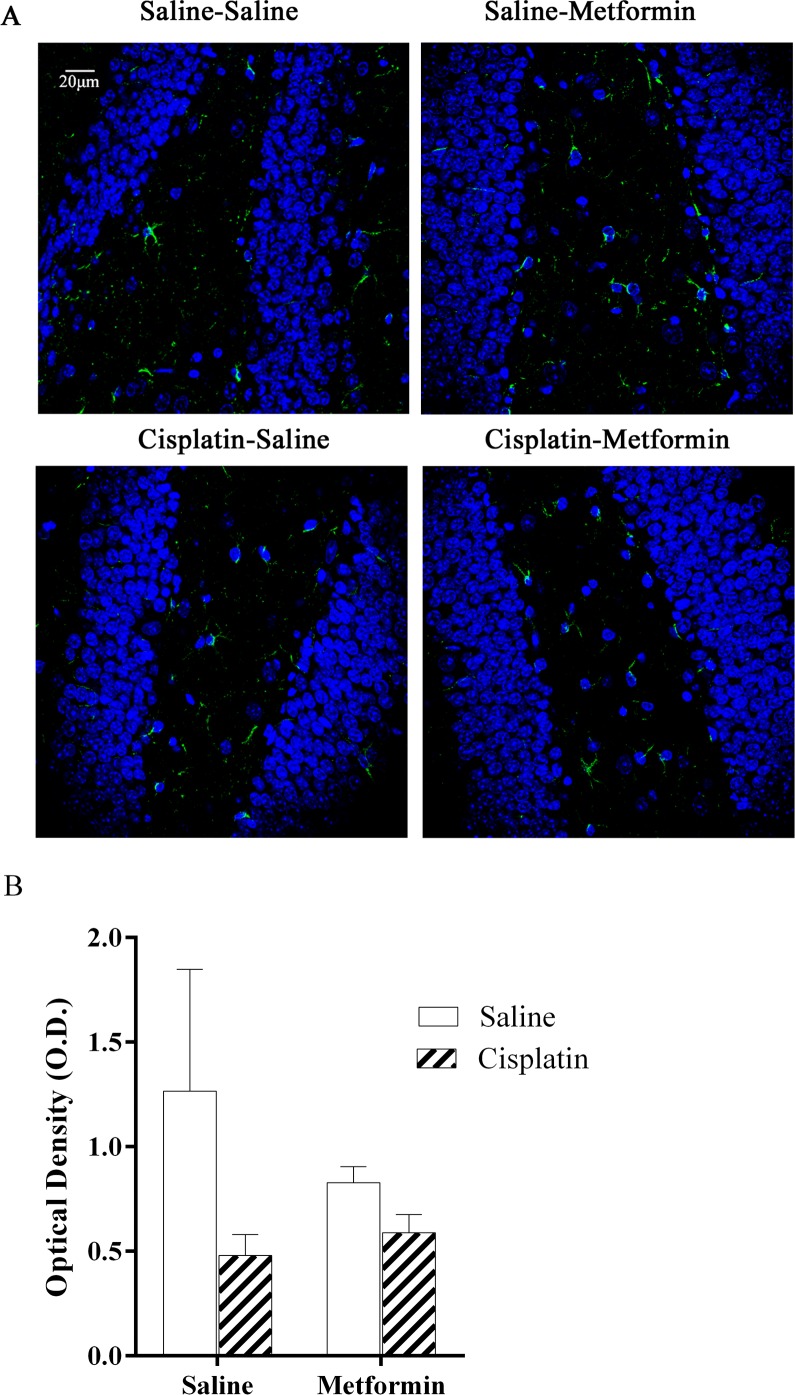
Fig 6. Astrocyte activation in brain of mice treated cisplatin and metformin.
Expression of GFAP as a measure of astrocyte activation was analyzed in hippocampus. (A). Green: GFAP; Blue: DAPI. (B) Quantification of GFAP expression. Data were analyzed by two-way ANOVA (cisplatin×metformin, F(1,16) = 0.8265, p>0.05). Scale bar: 20um. All data are expressed as mean±SEM. *, p<0.05. n = 5–6 per group

