
FIG. 1.
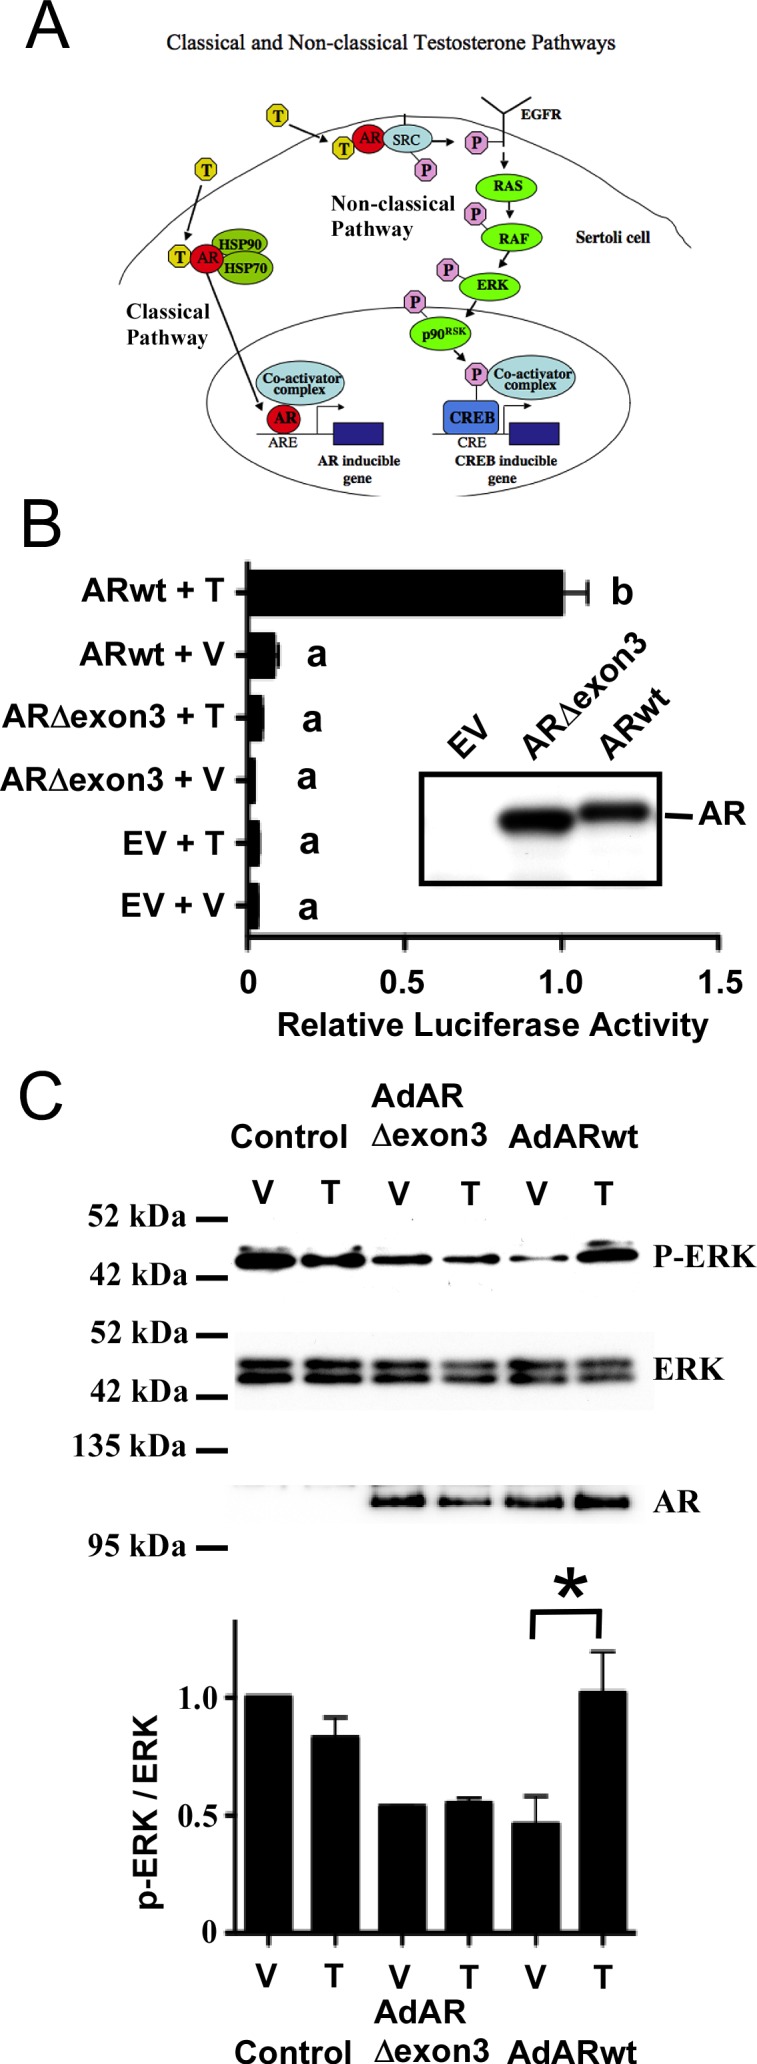
Deletion of exon 3 inhibits phosphorylation of ERK by the nonclassical T signaling pathway. A) The classical and nonclassical T signaling pathways. In the classical pathway (left) T diffuses through the plasma membrane and binds AR. A conformational change in AR allows the receptor to be released from heat shock proteins (HSP). AR then translocates to the nucleus, where it binds to AREs, recruits coactivator proteins, and regulates gene expression. In the nonclassical pathway (right), T stimulation transiently increases AR localization to the plasma membrane and results in AR interacting with and activating SRC tyrosine kinase. Activation of SRC can alter many physiological processes, including the phosphorylation and activation of the EGF receptor that in turn activates the MAP kinase cascade (RAF, MEK, and ERK). Further signaling through p90RSK kinase causes phosphorylation of the CREB transcription factor, resulting in increased transcription of CREB-regulated genes. B) The 15P-1 Sertoli cells were transfected with the PSALuc reporter plasmid and an empty expression vector (EV) or plasmids expressing ARΔexon3 or ARwt. The cells were stimulated with vehicle (V) or 100 nM T (T) for 24 h. The relative luciferase activity is reported relative to PSALuc + ARwt after 24 h stimulation with T (=1.0). Error bars show SEM for three experiments. Values with different lowercase letters differ significantly (P < 0.05). Inset: Western blot of whole cell extracts from 15P-1 cells transfected with empty vector (EV) or plasmids expressing ARΔexon3 or ARwt probed with antisera against AR. C) 15P-1 Sertoli cells were infected with adenovirus constructs expressing AdGFP (Control), exon 3-deleted AR (AdARΔexon3), or ARwt. The p-ERK, ERK, and AR levels were determined by Western blot after stimulation (10 min) with vehicle (V) or 100 nM T (T). Quantitation of the Western blot experiments is shown in the graph below. Relative p-ERK and ERK signal intensities were determined and the p-ERK/ERK ratio was determined for each sample. The p-ERK/ERK values obtained were normalized to the vehicle treated control condition (=1). The mean p-ERK/ERK values and SEM are shown for three experiments. A paired one-tailed t-test showed statistically significant differences (P < 0.05) between the control and T-treated samples only after transduction of the virus expressing ARwt (asterisk).