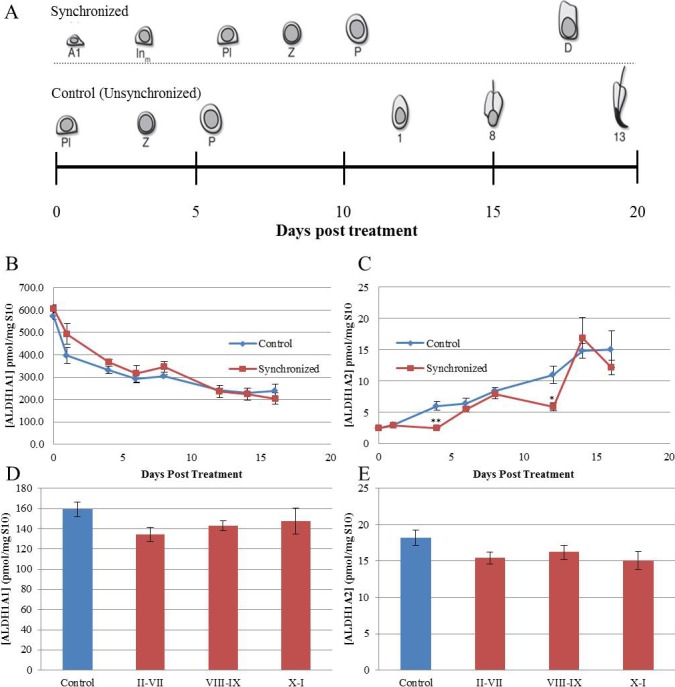
FIG. 3.

ALDH1A1 and ALDH1A2 levels do not vary in a manner similar to RA. A represents the cell types entering the testicular environment following synchrony protocol (top row) or control (bottom row). ALDH1A1 (B and D) and ALDH1A2 (C and E) protein levels were quantified in both synchronized (red) and control (blue) animals using a tandem HPLC-MS/MS approach. In the neonatal analysis (B and C), the vertical axis represents ALDH protein/mg of S10 protein. The horizontal axis represents time following neonatal synchrony treatment. Vertical error bars represent the SEM. Student t-tests were used to compare the protein levels in synchronized and control animals (*P < 0.05, **P < 0.01). In the synchronized adult analysis (D and E), 25 animals were collected at 12-h intervals between 42 and 50 days postsynchrony. The midpoint of synchrony was determined and used to bin each sample into three categories (stages II–VII, stages VIII–IX, and stages X–I). ALDH protein/mg of S10 protein was determined and averaged for both the unsynchronized controls (blue) and the three bins (red). The vertical control error bar is representative of the SEM for each category. ALDH1A3 levels were measured in both the adult and neonatal testis, but were at concentrations below the threshold of detection.
