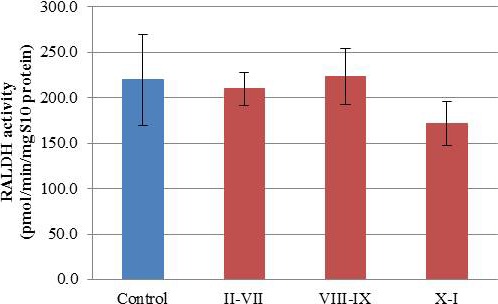
FIG. 4.

ALDH activity does not undergo cyclic changes. The graph represents mean ALDH activity (y-axis) within each category. The four categories used were: control (blue), stages II–VII, stages VIII–IX, and stages X–I (red). Error bars are representative of the SEM for each category.
