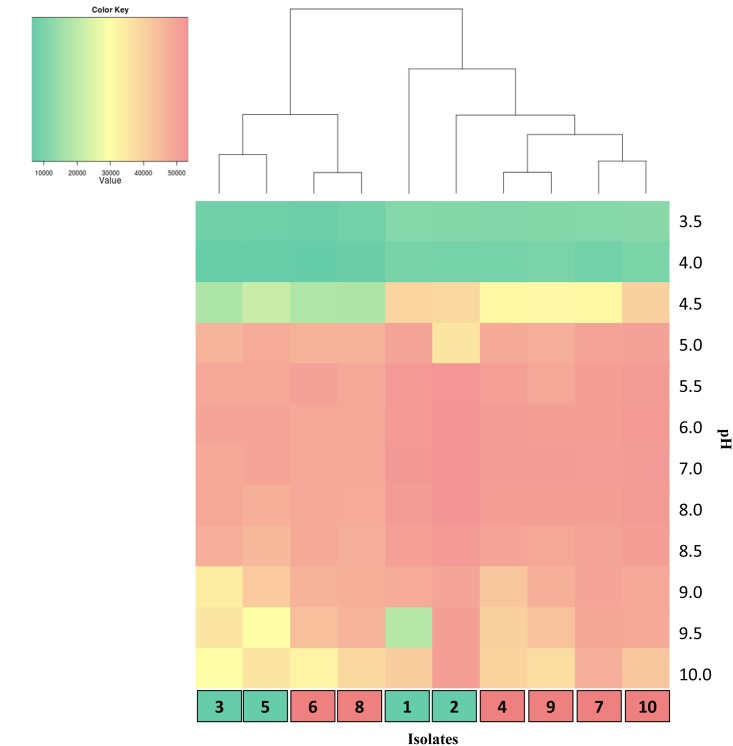
Fig 5. Growth of isolates over a pH range from 3.5–10.
Isolates were grown for 48 h at various pH ranging from 3.5 to 10. The colour key represents relative growth based on oxidative activity using area under the curve (Omnilog units). Isolates are identified in pink (super-shedders) and teal (low-shedders) boxes as in Fig 1.

