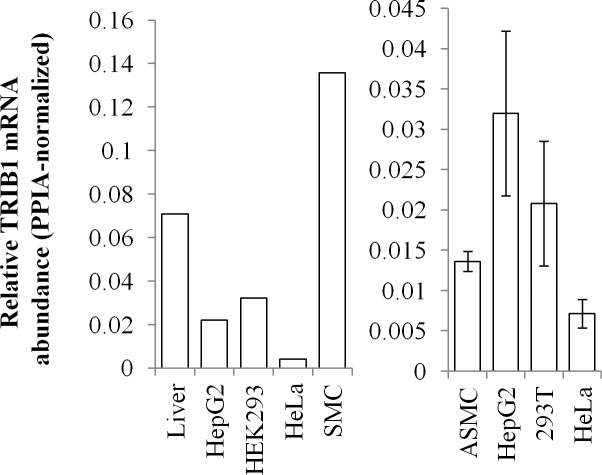
Fig 1. Endogenous TRIB1 is expressed at low levels in several cell models.
Left, RNA quantification by RNAseq calculated from to the Human Protein Atlas portal data, using PFKM counts for the indicated tissue (SMC, Liver) or cell lines (HepG2, HEK293). Right, RNA quantification by qRT-PCR in the indicated cell models. Abundance is normalized to PPIA. Quantification of 3–6 experiments is shown (± 95% CI).

