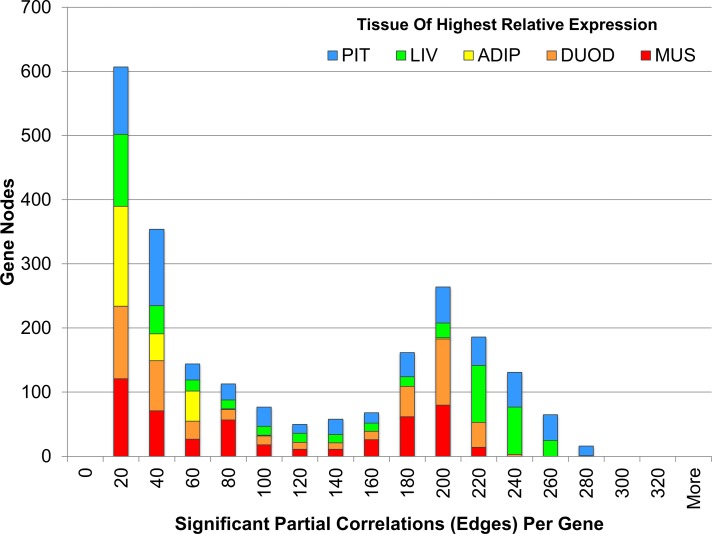
Fig 4. Distribution of significant partial correlations per gene in the co-expression network.
This figure shows the number of significant partial correlations (or edges in the gene co-expression network) with other genes, ranging up to 280 per gene node. For each bin, genes are grouped by the tissue of highest relative expression, including pituitary (light blue), skeletal muscle (red), liver (light green), visceral adipose (yellow), and duodenum (orange), to give an approximation of the distribution within tissue. The pituitary, liver and duodenum are most highly represented among the genes with the highest number of edges.

