
Figure 4.
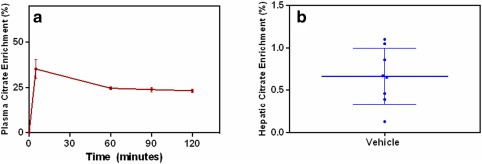
Plasma and hepatic enrichment of 13C‐citrate in mice i.v. infused with 13C‐citrate. (a) Plasma citrate enrichment was illustrated as a time sequential profile (red). (b) In the liver, the enrichment was a timepoint measurement (blue) taken 120 minutes after the infusion, when steady state was reached. For all the measurements, both mean and SD values are shown on the plots.