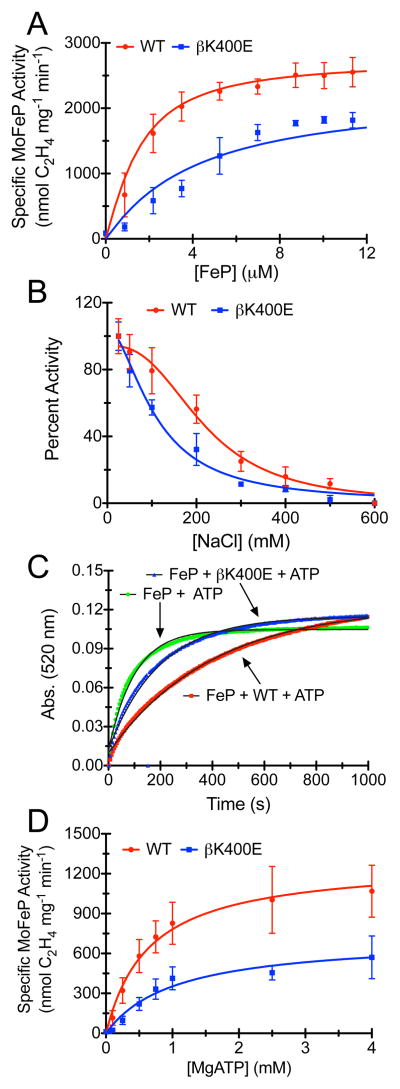
Figure 3.
(A) Nitrogenase C2H2 reduction assays for WT- and βK400E-MoFeP. The solid lines represent the Thorneley-Lowe simulation. (B) Inhibition of nitrogenase by NaCl. The solid lines represent the best-fit curves to an IC50 equation. (C) Chelation of the [4Fe:4S] cluster from ATP-bound FeP by 2,2-bipyridine in absence of MoFeP or in presence of WT-MoFeP or βK400E-MoFeP. The solid lines represent the single exponential fits of the data. Data for control experiments lacking FeP or ATP are shown in Figure S8. (D) ATP activation of WT- and βK400E-MoFeP. The lines represent the Michaelis-Menten fits of the data. A normalized version of Figure 3D can be found in Figure S9.

