
Figure 1.
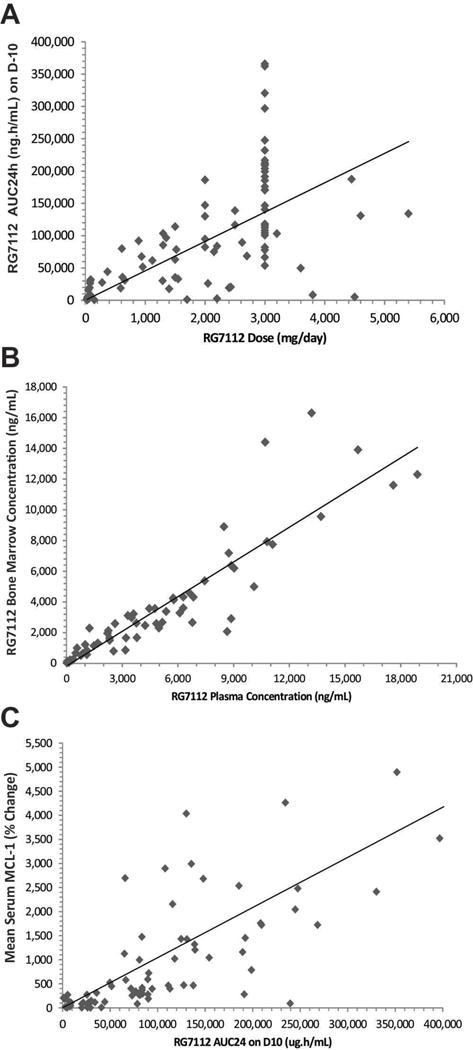
RG7112 pharmacokinetics and pharmacodynamics data. A, Correlation between RG7112 dose (mg/day) and exposure (AUC2 24 h [ng/h/mL]) for Stratum A and Stratum B on day 10. The diamonds represent individual patients. B, Correlation between RG7112 levels in bone marrow (ng/mL) and plasma concentration (ng/mL). The diamonds represent individual patients. C, Correlation between mean serum MIC-1 levels (% change) and RG1172 plasma levels (AUC24 [μg/h/mL] on day 10. The diamonds represent individual patients. MIC-1, macrophage inhibitory cytokine-1; AUC, area under curve; D, day.