
Figure 2.
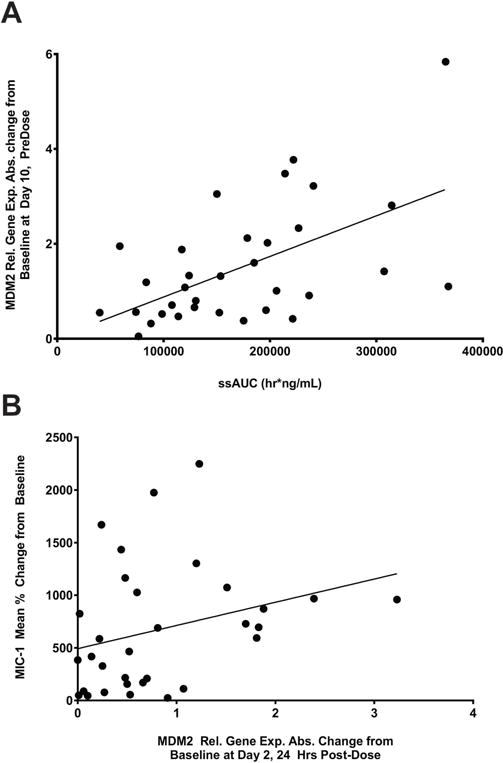
Increased drug exposure to RG7112 correlates with increased MDM2 mRNA levels. A, Scatter plot of the absolute change from baseline of MDM2 relative gene expression levels at day 10 pre-dose of cycle 1 in the blood vs AUCss (hr/ng/mL) of Stratum A patients. The circles represent individual patients. AUCss,area under curve at steady state; MDM2,murine double minute 2. B, Scatter plot of the absolute change from baseline of MDM2 relative gene expression levels at day 2 24 h post-dose in the blood vs MIC-1 of Stratum A patients. The circles represent individual patients. MIC-1,macrophage inhibitory cytokine-1; MDM2,murine double minute 2.