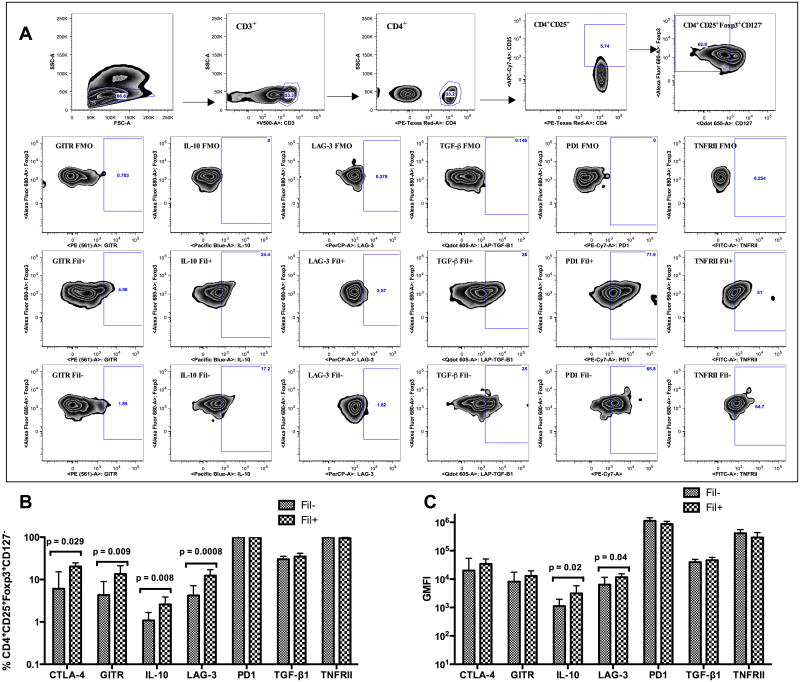
Figure 1. Treg cells from Fil+ subjects have higher frequencies of CTLA-4+, GITR+, LAG-3+ and IL-10+ cells.
Multiparameter flow cytometry was used to determine the frequencies of Treg cells expressing CTLA-4, GITR, LAG-3, PD1, TNFRII, LAP-TGF-β, or IL-10. (A) The gating strategy for the identification of Treg cells, the FMO gating for positive events and representative graphs of each marker on Treg cells from a Fil+ and Fil- subject are shown. (B) The frequencies of Treg cells (CD4+CD25+Foxp3+CD127low) expressing CTLA-4, GITR, LAG-3, PD1, TNFRII, LAP-TGF-β, or IL-10 were determined by flow cytometry. (C) The integrated geometric mean (GM) fluorescence intensity (iGMFI) for each subset is also shown. Data are shown as geometric mean + 95% confidence interval of 18 Fil+ or 19 Fil− subjects. Statistical significance determined by Mann-Whitney U test.

