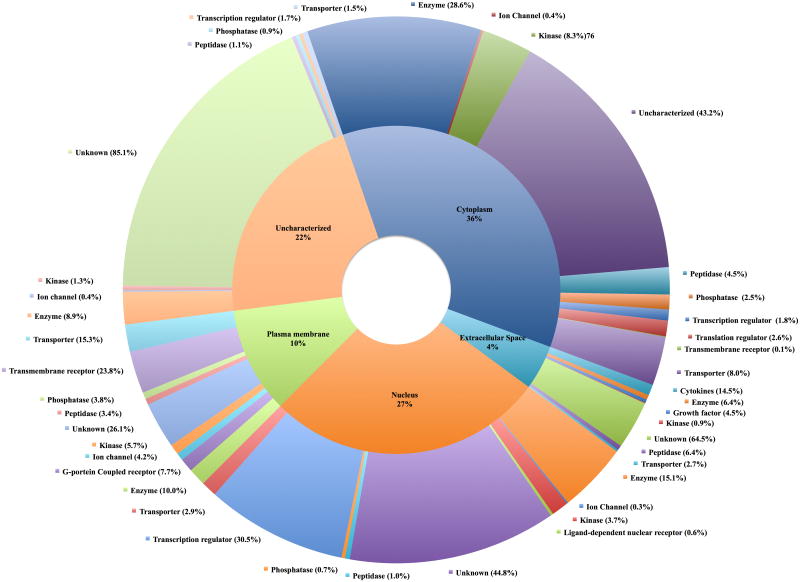
Figure 2. Differentially regulated genes in Treg cells from Fil+ subjects have no known functional category.
Differentially expressed genes were imported into the IPA software to determine the cellular location and functional categories. These data were used to plot the doughnut graph. The inner pie chart represents the cellular location of the differentially expressed gene and the outer pie chart represents the different functional category for each cellular location. For functional category, the percentage shown represents the relative abundance of that category in a specific location.

