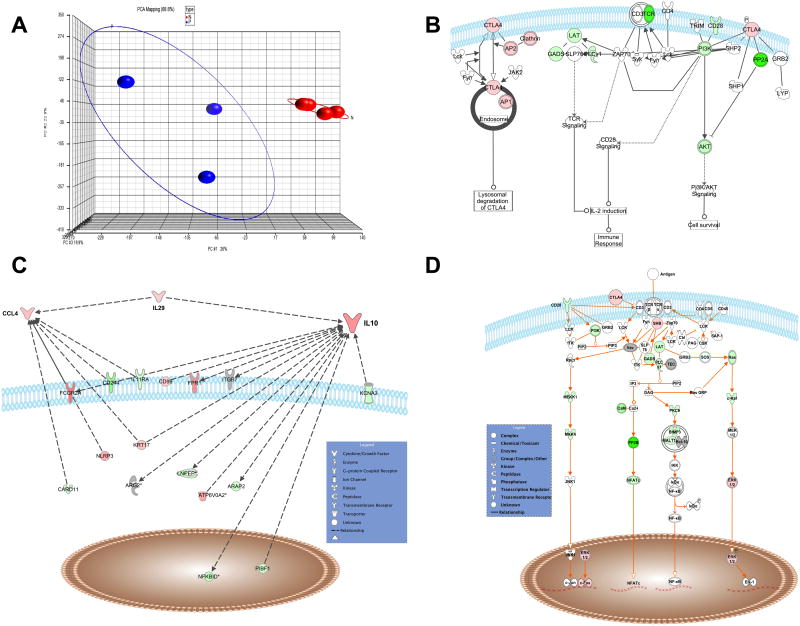
Figure 3. Heterogeneous populations of Treg cells with upregulated expression of regulatory markers.
(A) The principal component analysis (PCA) in which each sphere represents the result from an individual sample (chip) with the plotted location based upon the grouping of each sample relative to the others is shown. The blue spheres represent Treg cells from Fil+ and those from Fil− are shown in red. (B-D) The list of the top 10% and two-fold differentially regulated genes of Treg cells from Fil+ compared with Treg cells from Fil− was then imported into IPA for pathway anlaysis. The pathways of (B) CTLA-4, (C) IL-10 and (D) TCR signaling with differentially upregulated (red) or downregulated (green) genes in Treg cells from Fil+ relative to Treg cells from Fil− are shown.

