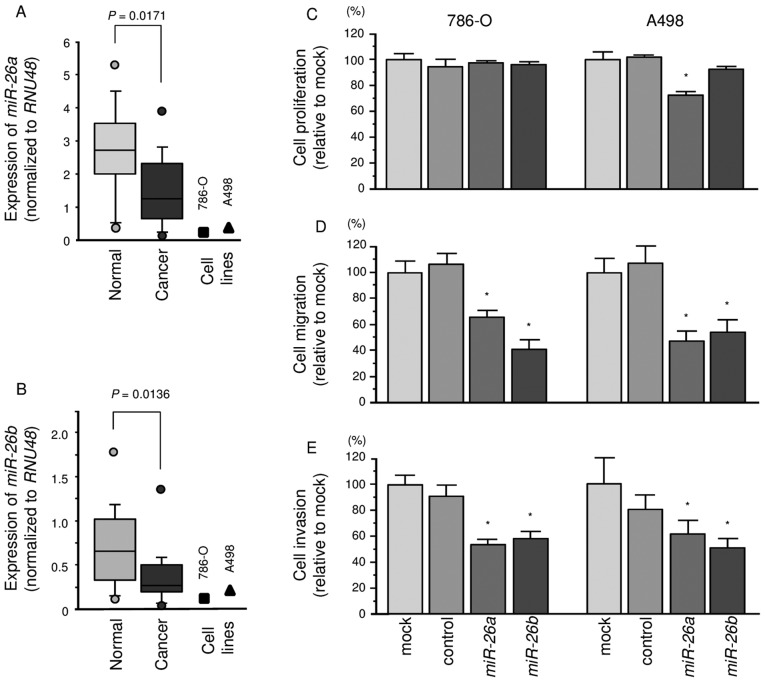
Figure 1.
Expression levels of miR-26a and miR-26b in ccRCC clinical specimens and cell lines 786-O and A498. (A and B) Quantitative real-time RT-PCR showed that the expression levels of miR-26a and miR-26b were significantly lower in ccRCC tissues and RCC cell lines than in normal kidney tissues. RNU48 was used as an internal control. (C–E) Effects of miR-26a or miR-26b transfection on RCC cell lines 786-O and A498. (C) Cell proliferation was determined by XTT assays 72 h after transfection with miR-26a or miR-26b (10 nM). (D) Cell migration activity was determined by wound-healing assays 48 h after transfection with miR-26a or miR-26b (10 nM). (E) Cell invasion activity was determined by Matrigel invasion assays 48 h after transfection with miR-26a or miR-26b (10 nM). *P<0.001.

