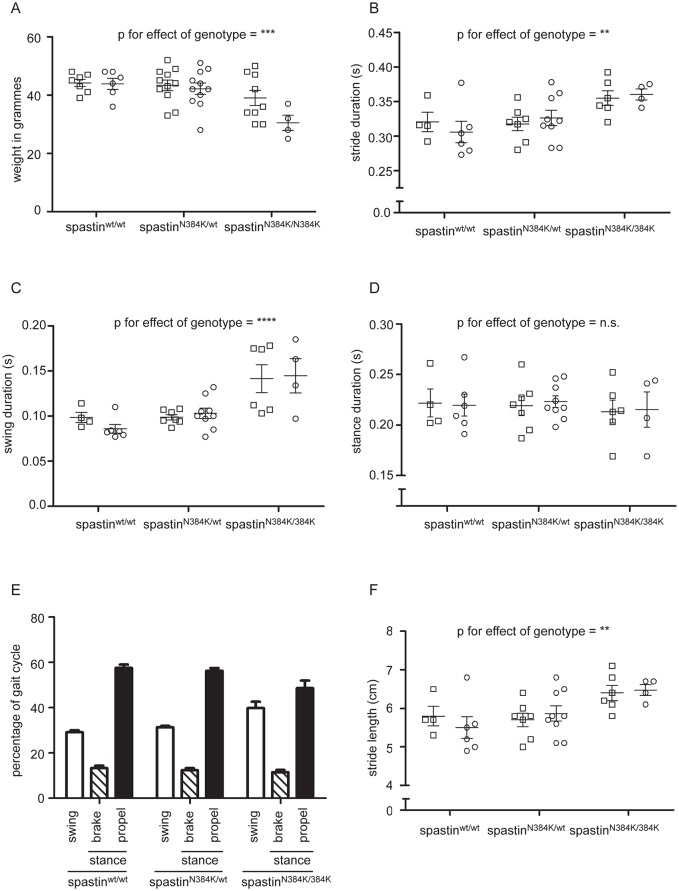
Fig 3. Weight and key left hindlimb gait parameters in spastinN384K/N384K mice versus littermate controls at 1 year old.
Plots show values for each animal tested with the genotypes indicated. Squares = male animals, circles = females. A) weight in grammes, B) stride duration, C) swing phase duration, D) stance phase duration. E) Histogram showing the mean percentage of time that tested animals with the genotypes indicated spent in each phase of gait. F) Stride length in animals with the genotypes shown. Error bars = mean ± S.E.M. Numerical p-values for corresponding statistical tests using two-way ANOVA for the effect of gender and genotype on gait parameters are shown in Table 2. To facilitate interpretation, p-values for genotype are indicated on the plots by * p<0.05, ** p<0.01, *** p<0.001, **** p<0.0001.

