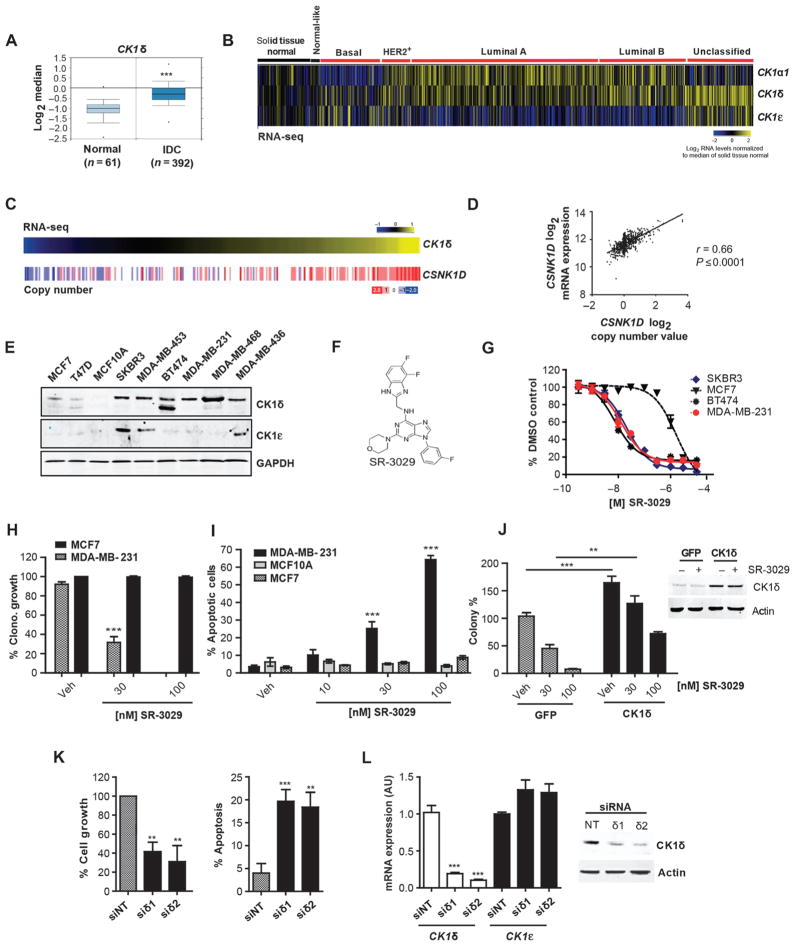
Fig. 1. CK1δ is a clinically relevant and effective target for select breast cancer subtypes.
(A) CK1δ mRNA expression in invasive ductal breast carcinomas (IDC) vs. adjacent normal tissue (***, p=6.78e–15). (B) Expression of CK1α1, CK1δ, and CK1ε across PAM50 breast cancer subtypes based on RNA-Seq data (n=972 tumor samples, 113 solid tissue normal). Log2 normalized read count (RSEM) is shown. (C) CSNK1D DNA copy number analysis in invasive breast carcinomas clustered according to CK1δ expression (n=303). Gene-level copy number estimates (GISTIC2 threshold) of −2 (dark blue), −1 (light blue), 0 (white), 1 (light red), 2 (dark red), representing homozygous deletion, single copy deletion, diploid normal copy, low-level copy number amplification, or high-level copy number amplification are shown. (D) Scatter plot of CSNK1D Log2 mRNA expression vs. Log2 copy number values (972 breast cancer patients). (E) CK1δ and CK1ε protein expression in indicated breast cancer cell lines and MCF10A mammary epithelial cells. (F) Chemical structure of SR-3029. (G) Anti-proliferative potency of SR-3029 in the indicated breast cancer cell lines. Data are plotted as % proliferation vs. vehicle (n=6). (H) Clonogenic growth and survival of the indicated cells in the presence of SR-3029 or vehicle (n=3; p=0.0008). (I) Percent apoptosis by PI /Annexin V FACS after 72 hours of treatment with indicated doses of SR-3029 (n=3; ***, left to right p=0.0007 and 0.0001). (J) Left, Clonogenic growth of MDA-MB-231 cells overexpressing CK1δ or GFP +/− SR-3029 (n=3; ***, p=0. 001, **, p=0.0035). Right, western blot confirming CK1δ overexpression +/− 30 nM SR-3029 at 48 hours. (K) Relative growth (left; n=3, siδ1; p=0.01, siδ2; p=0.003) and percent cell death by trypan blue dye exclusion (right; n=3, siδ1; p=0.01, siδ2 p=0.027) 5 days after transfection of MDA-MB-231 with non-targeting (NT) or CK1δ siRNAs. (L) qPCR data and immunoblot confirming knockdown of CK1δ but not CK1ε (n=3; ***, p<0.0001).

