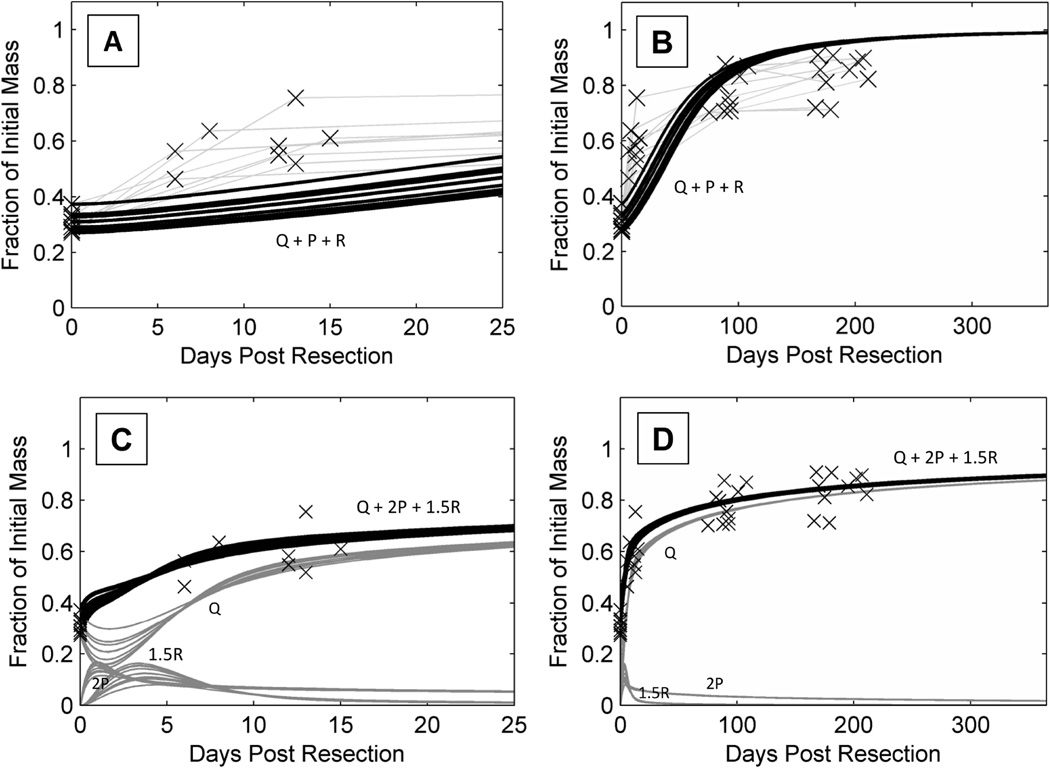
Figure 3. Improved mathematical model of human liver regeneration.
A and B show the original model applied to DQLFT data with the same cell cycle parameters used in Periwal et al (2014). C and D show the updated model with the original rat cell cycle parameters and optimized metabolic load parameter, including individual populations of Q, P, R cells.
A and C show liver regeneration over the span of 25 days (n = 8), B and D show liver regeneration over the span of 1 year (n = 10).

