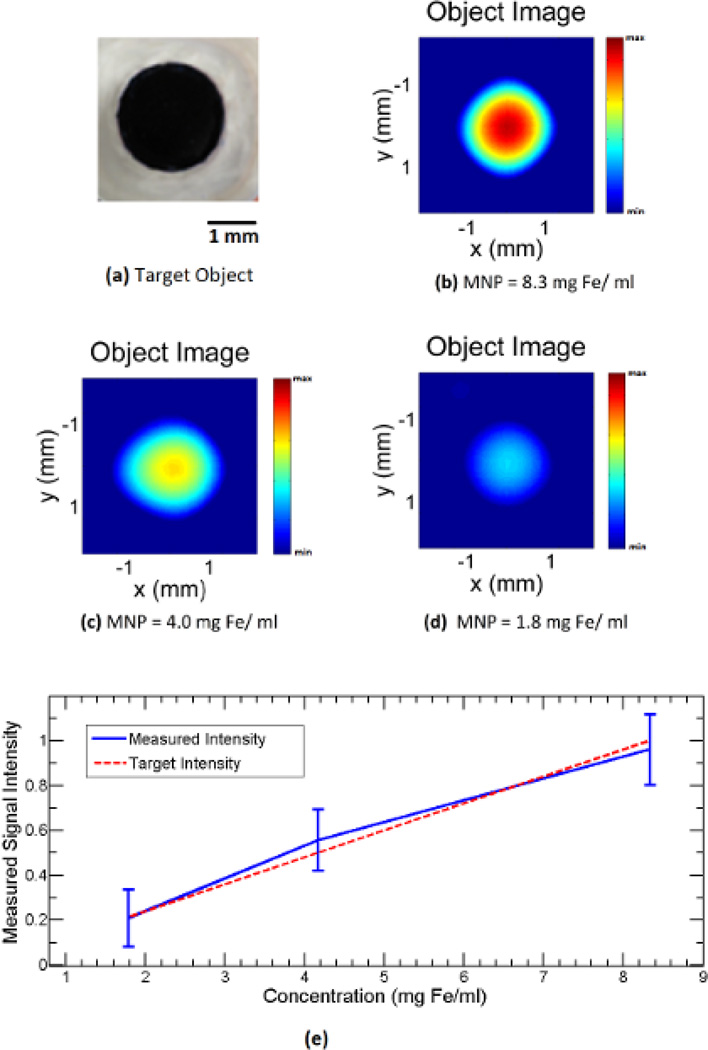
Fig 4.
Imaging experiment with a small circular inclusion of IONP at different concentrations in 1 % background agar gel. (a) Top view photo of the imaging object. (b),(c),(d) MAT images of the object with IONP concentration of ~8.3, 4.0, 1.8 mg Fe/ml respectively. (e) Plot of the measured image intensity with respect to the IONP concentration.

