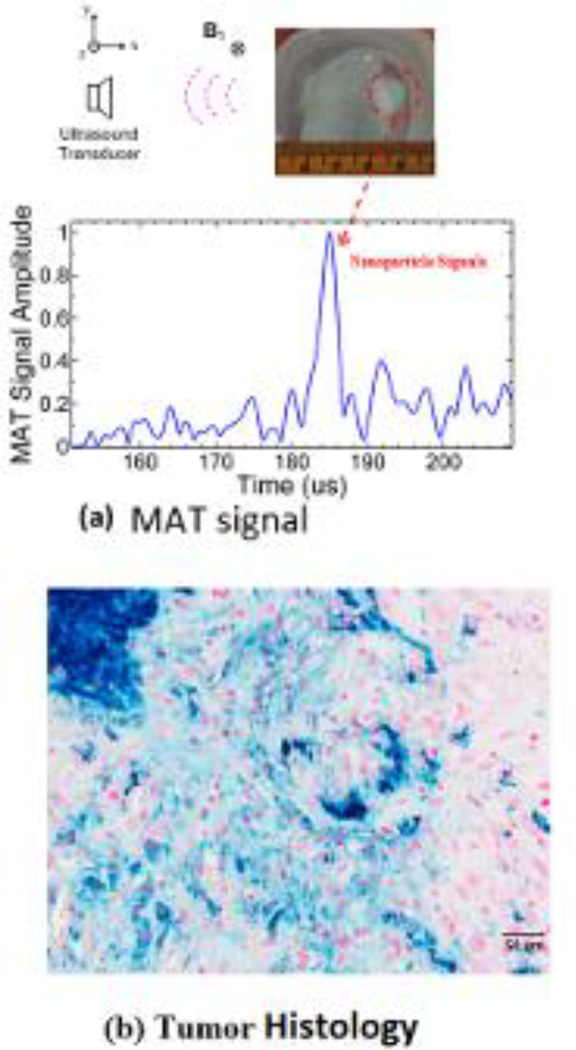
Fig 5.
(a) Top view photo of the imaging object showing the tumor region in the mouse and the corresponding MAT signal due to the embedded IONPs. (b) Histological cross section of the tumor injected with IONPs. The section is stained with Prussian blue stain and counter stained with nuclear fast red with the blue areas indicating the IONPs.

