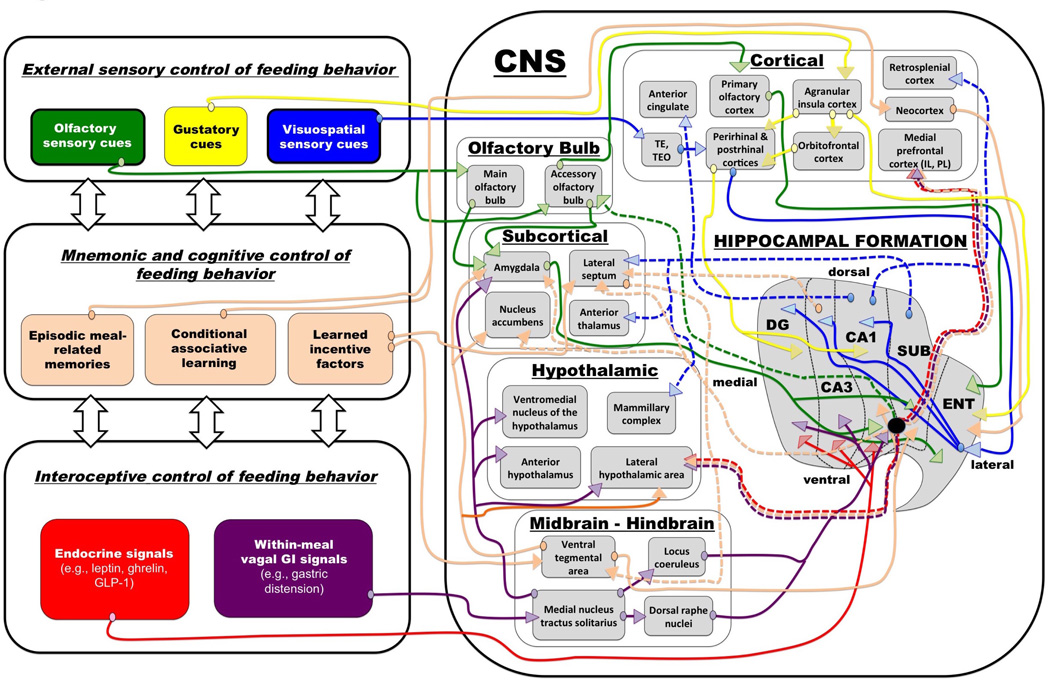
Figure 1.
Model for the central integration of information related to energy balance and its convergence within the hippocampal formation. Extrinsic energy-balance related connections of the hippocampal formation are represented by colored lines (solid lines = inputs, dashed lines = outputs, arrows = afferent targets, ovals = connection origin; color coded to represent different categories of information). The “flat-map” representation of the hippocampal formation depicts an unfolded rat hippocampus [adapted from (40)]. The black disk indicates the position of ventral CA1 / subiculum containing glutamatergic output neurons that process and transmit energy balance-relevant signals. Abbreviations: CA1,3 = field 1, 3 of Ammon’s horn, DG = dentate gyrus, SUB = subiculum, ENT = entorhinal areas.

