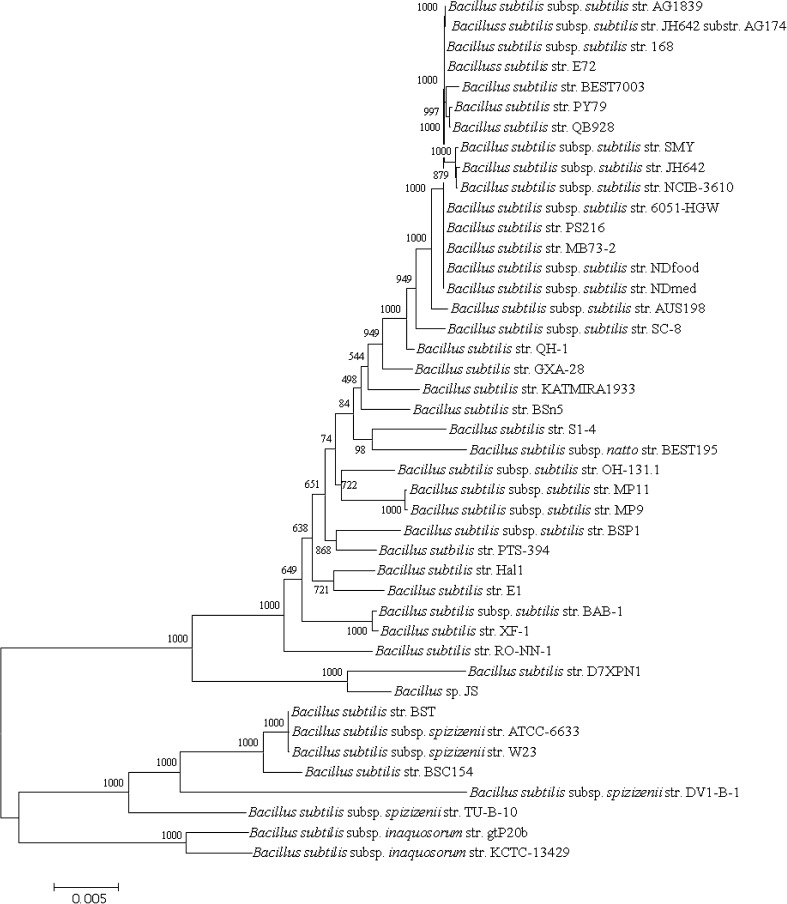
Fig. 5.
Maximum Likelihood phylogenetic tree of B. subtilis (n = 43) constructed from a superalignment of sequences from 1724 protein orthologs of B. subtilis genomes using the hal pipeline with default parameters. Distances were corrected using the Jone-Taylor (JTT) model with 1000 non-parametric bootstrap replicates. The bootstrap values are represented by numbers at nodes. Scale bar indicates 5 differences in every 1000 amino acids (0.5 %). Refer to Table 2 for the type strains in this figure

