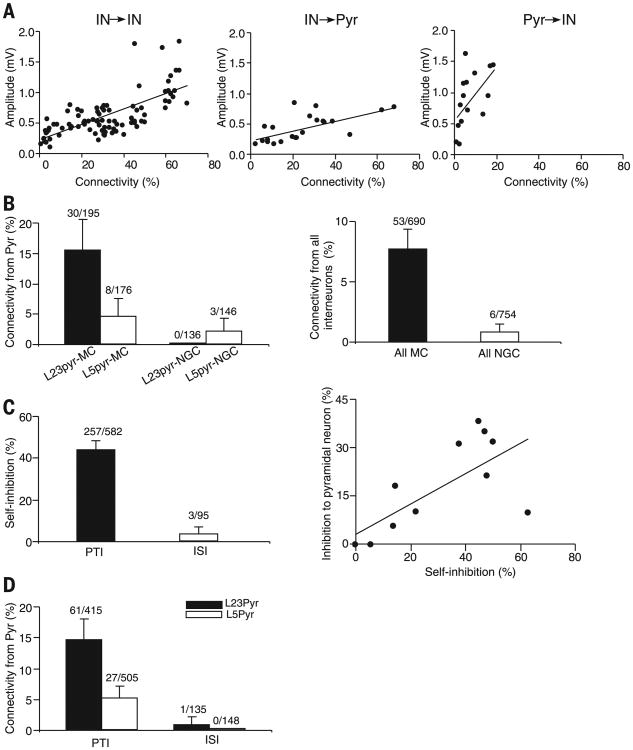
Fig. 5. Principles of connectivity in neocortical circuits.
(A) Connection probability correlates with mean synaptic strength. Plot of the mean amplitudes of uIPSPs or uEPSPs of each type of connection against the connectivity rate for each type of connection [r(96) = 0.70, P < 0.0001 for interneuron→interneuron connection; r(20) = 0.65, P = 0.001 for interneuron→pyramidal neuron connection; r(14) = 0.56, P = 0.03 or pyramidal neuron→interneuron connection]. (B) (Left) Connectivity rate from excitatory cells to MCs and NGCs. (Right) Connectivity rate from all (non-MC, non-NGC) interneurons to MCs and NGCs. (C) (Left) The self-connections of PTI occurs in 44.2% (257/582; pooling across all PTIs), whereas self-inhibition between ISIs occurs only in 3.2% (3/95) of tested connections (GLM with factor of class of interneuron (PTI vs. ISI); P < 0.0001). (Right) There is a strong positive correlation between inhibition of pyramidal neurons and self-inhibition [r(11) = 0.72; p = 0.01]. Note that origin contains three points. (D) Pyramidal cells provided input to PTIs in 14.7% (61/415; pooling across all PTIs, from L23Pyr) and 5.3% (27/505, from L5Pyr) of the tested connections, whereas pyramidal cells rarely provided input to ISIs (0.74%, 1/135; 0.0%, 0/148 for L23 and L5 pyramidal neurons, respectively; GLM with factors of class of interneuron (PTI vs. ISI) and layer of pyramidal neuron; effect of interneuron class: P = 0.005; layer: P = 0.009; interaction: P = 0.76).

