Figure 8.

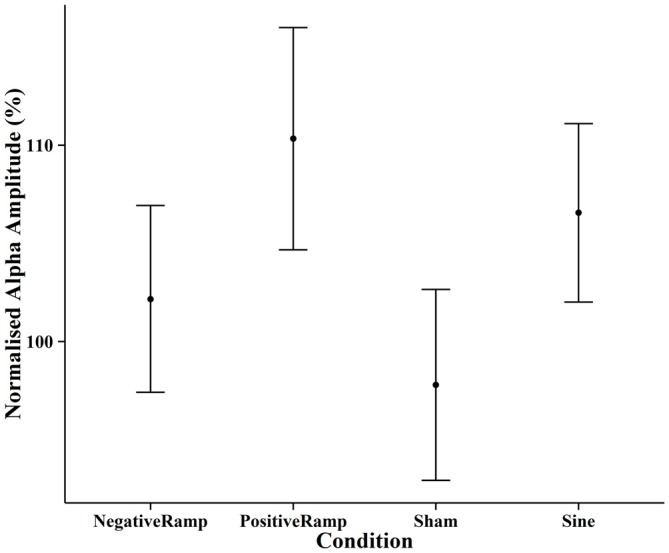
Normalised mean alpha amplitude post-stimulation for each condition, error bars show ±1 standard error of the mean. None of the differences between conditions reached significance for the pre-post comparison.

Normalised mean alpha amplitude post-stimulation for each condition, error bars show ±1 standard error of the mean. None of the differences between conditions reached significance for the pre-post comparison.